Buyers are out in full force with over 40 viewings completed this weekend alone. In particular we are seeing huge demand for properties with 3 and 4 bedrooms in KT8 and KT10 postcodes.
If you're looking to sell your property please do get in touch with us!
If I had £1 for everytime someone asked me "what is the property market like at the moment?" I could pay off the mortgage for every friend and family member in the contact list on my phone!
The nature of the private housing market in Britain means that it is always changing and evolving, and the value of your property can change from month to month, and so called uncertainty surrounding UK politics has left many people unsure as to how this has affected the value of their home.
With the Pound (£) offering very good value for money against the Euro and US dollar, foreign purchases in Central London are reportedly on the up again, and as Molesey was more or less built for commuters, this has a knock on affect within our local market as many buyers who move to Molesey, do so after selling a property in London in search of more square footage, garden space and good schools whilst retaining the ability to get to work in London with relative ease.
So what does the property market look like now compared to this time last year? 2018 was our busiest year yet at Newton Huxley, and here is why we are confident that 2019 will be the same, if not better.
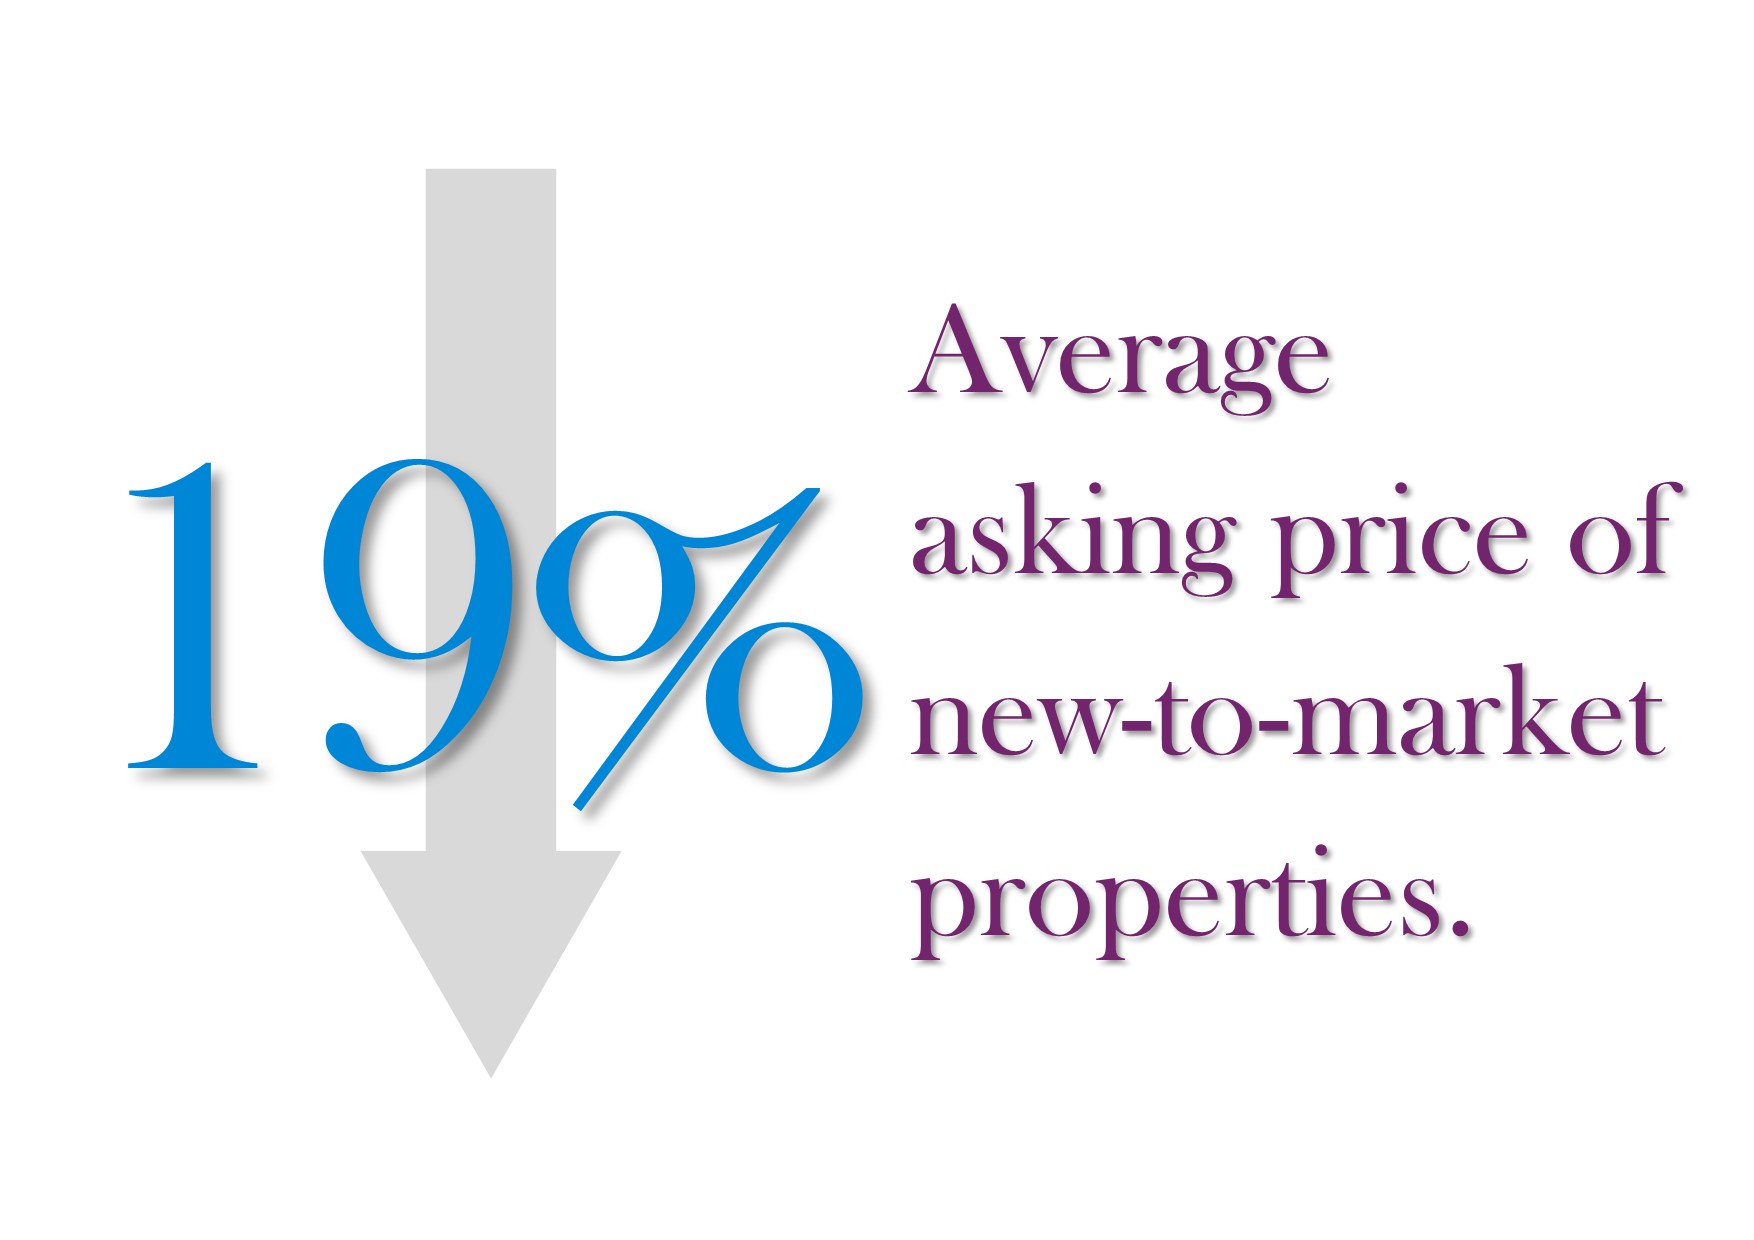
Now this does not mean that asking prices are down by nearly 20%! We have noticed more properties coming to market below the £500k threshold which shows more confidence from those looking to upsize from their first purchase. We also published an article last year explaining that over inflated asking prices were causing a slow down in the market (as commented on by The Times in their recent article about overvaluing) and that the eventual sale prices of properties had remained more or less the same, this shows that home sellers are adjusting their asking prices to be more in line with buyer expectations which will increase movement.
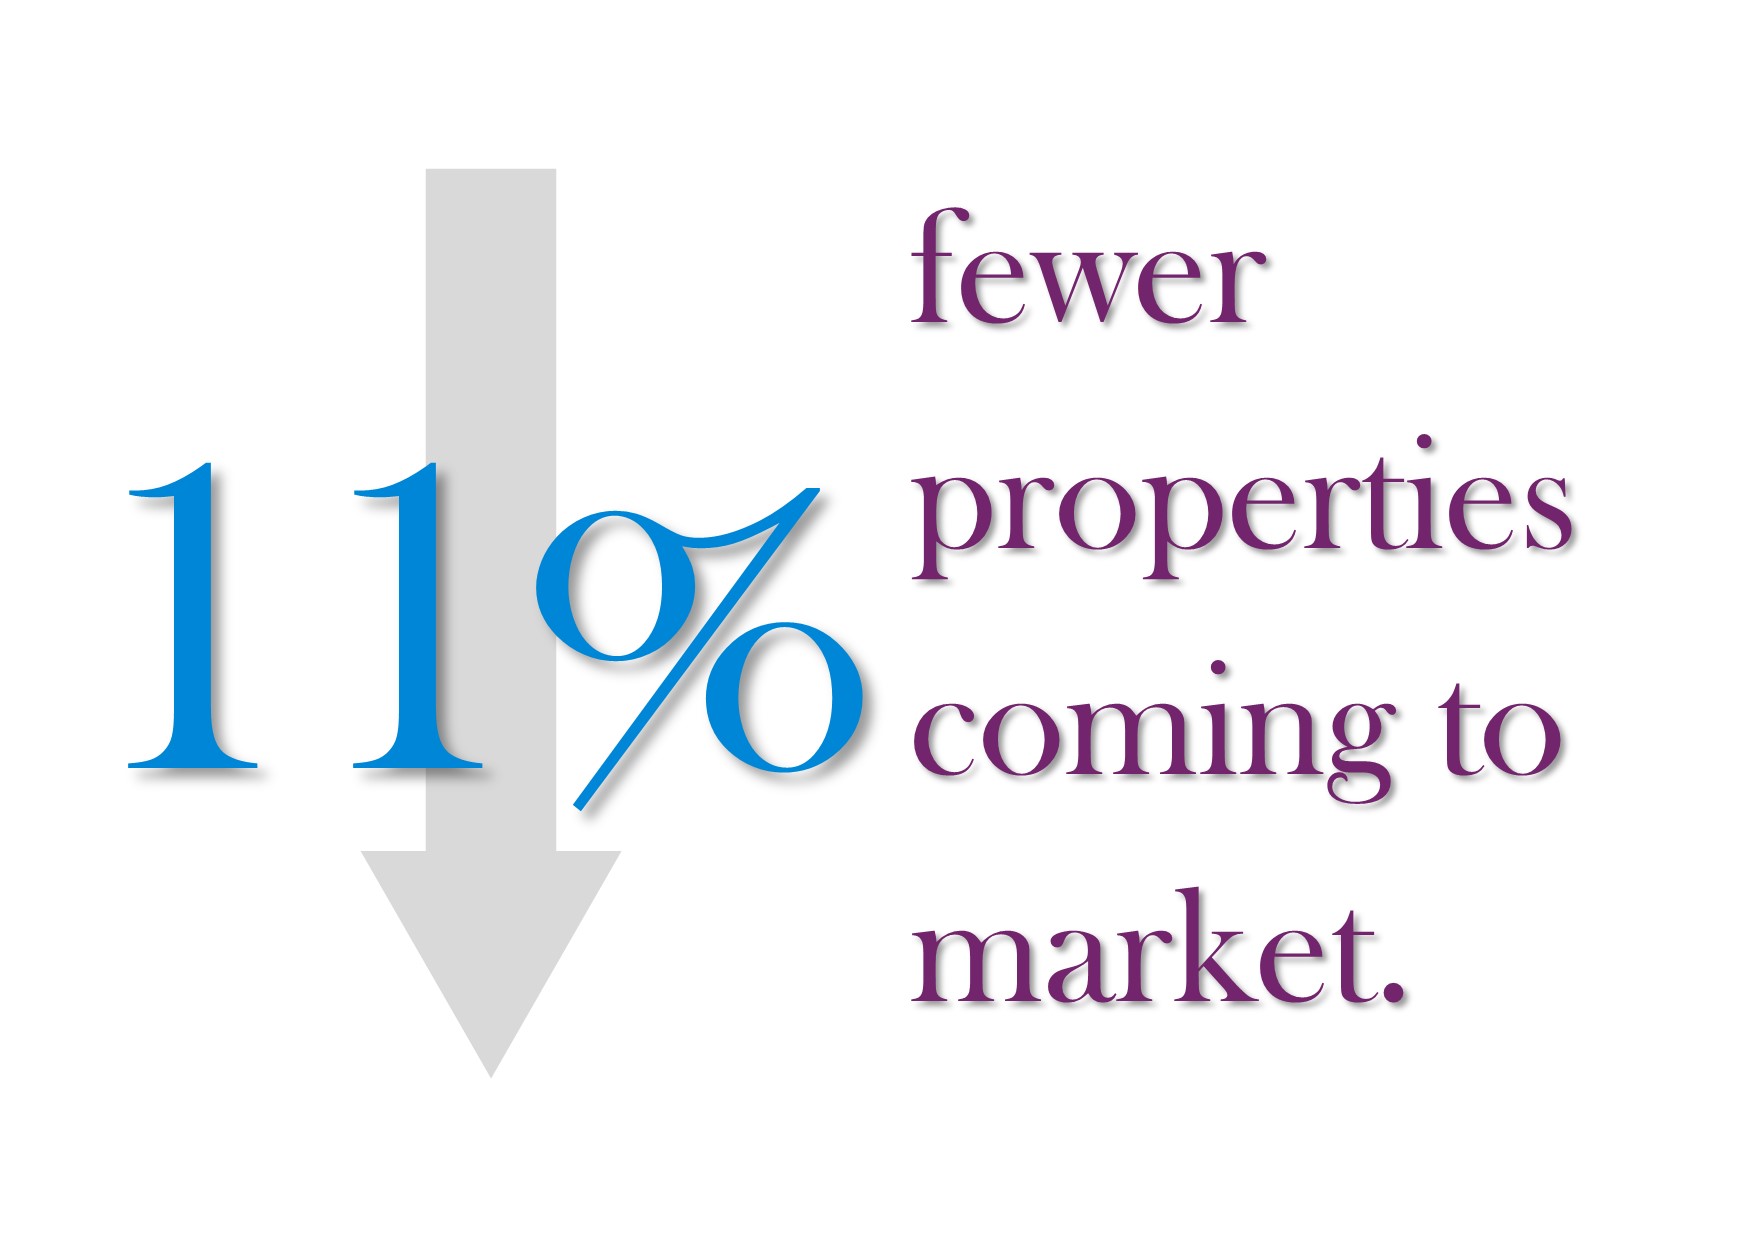
The number of new properties coming to market has been in decline for the past 2-3 years. In terms of real numbers, the difference is 73 new properties in 2018 vs 65 in 2019 and although this will help speed up a potential buyers decision making with slightly less choice to consider, we do not see this having any significant affect on pricing at this level.
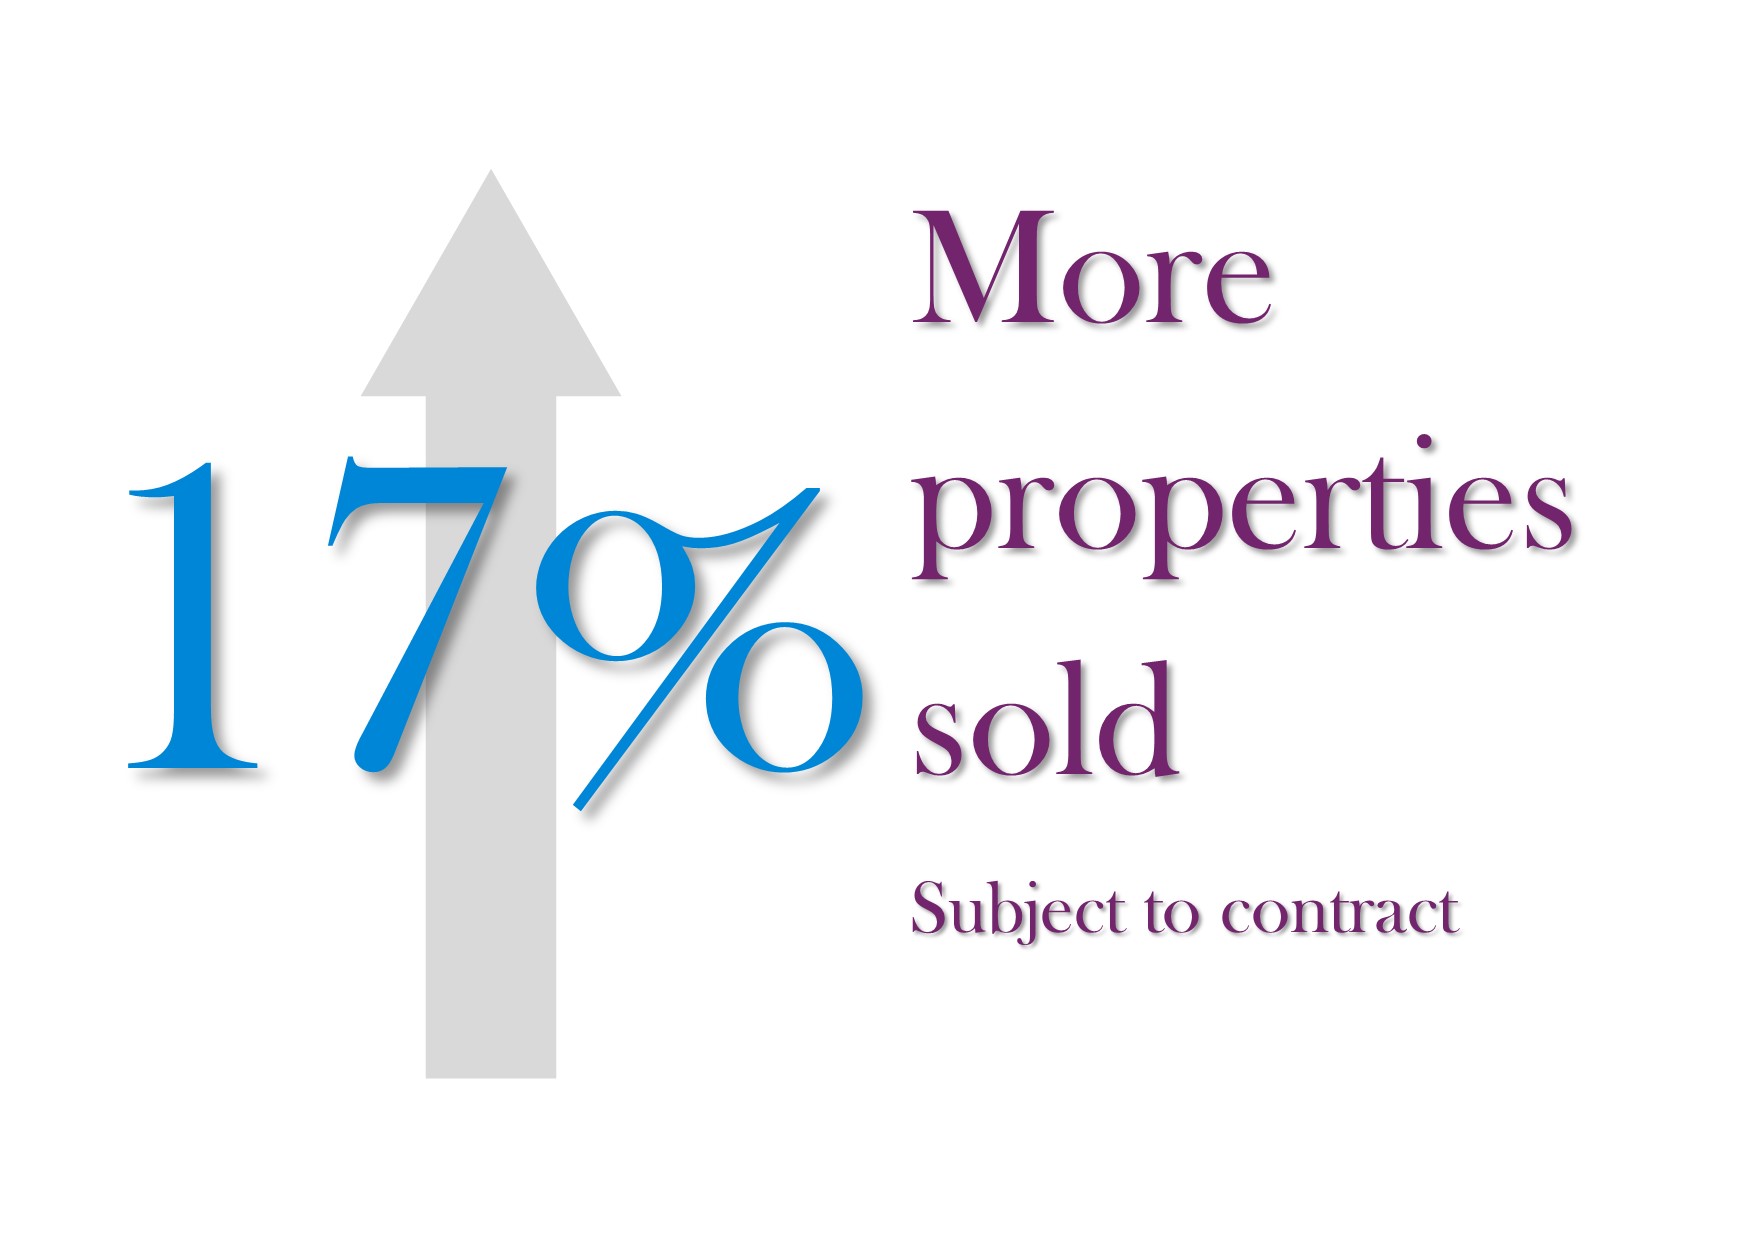
This is ultimately a result of the above two market factors, with less choice and more affordable properties on offer, activity will naturally increase. We have also noticed increased interest in properties that have previously been struggling to achieve a sale, showing further increased movement within Central and SW London is having a positive impact.
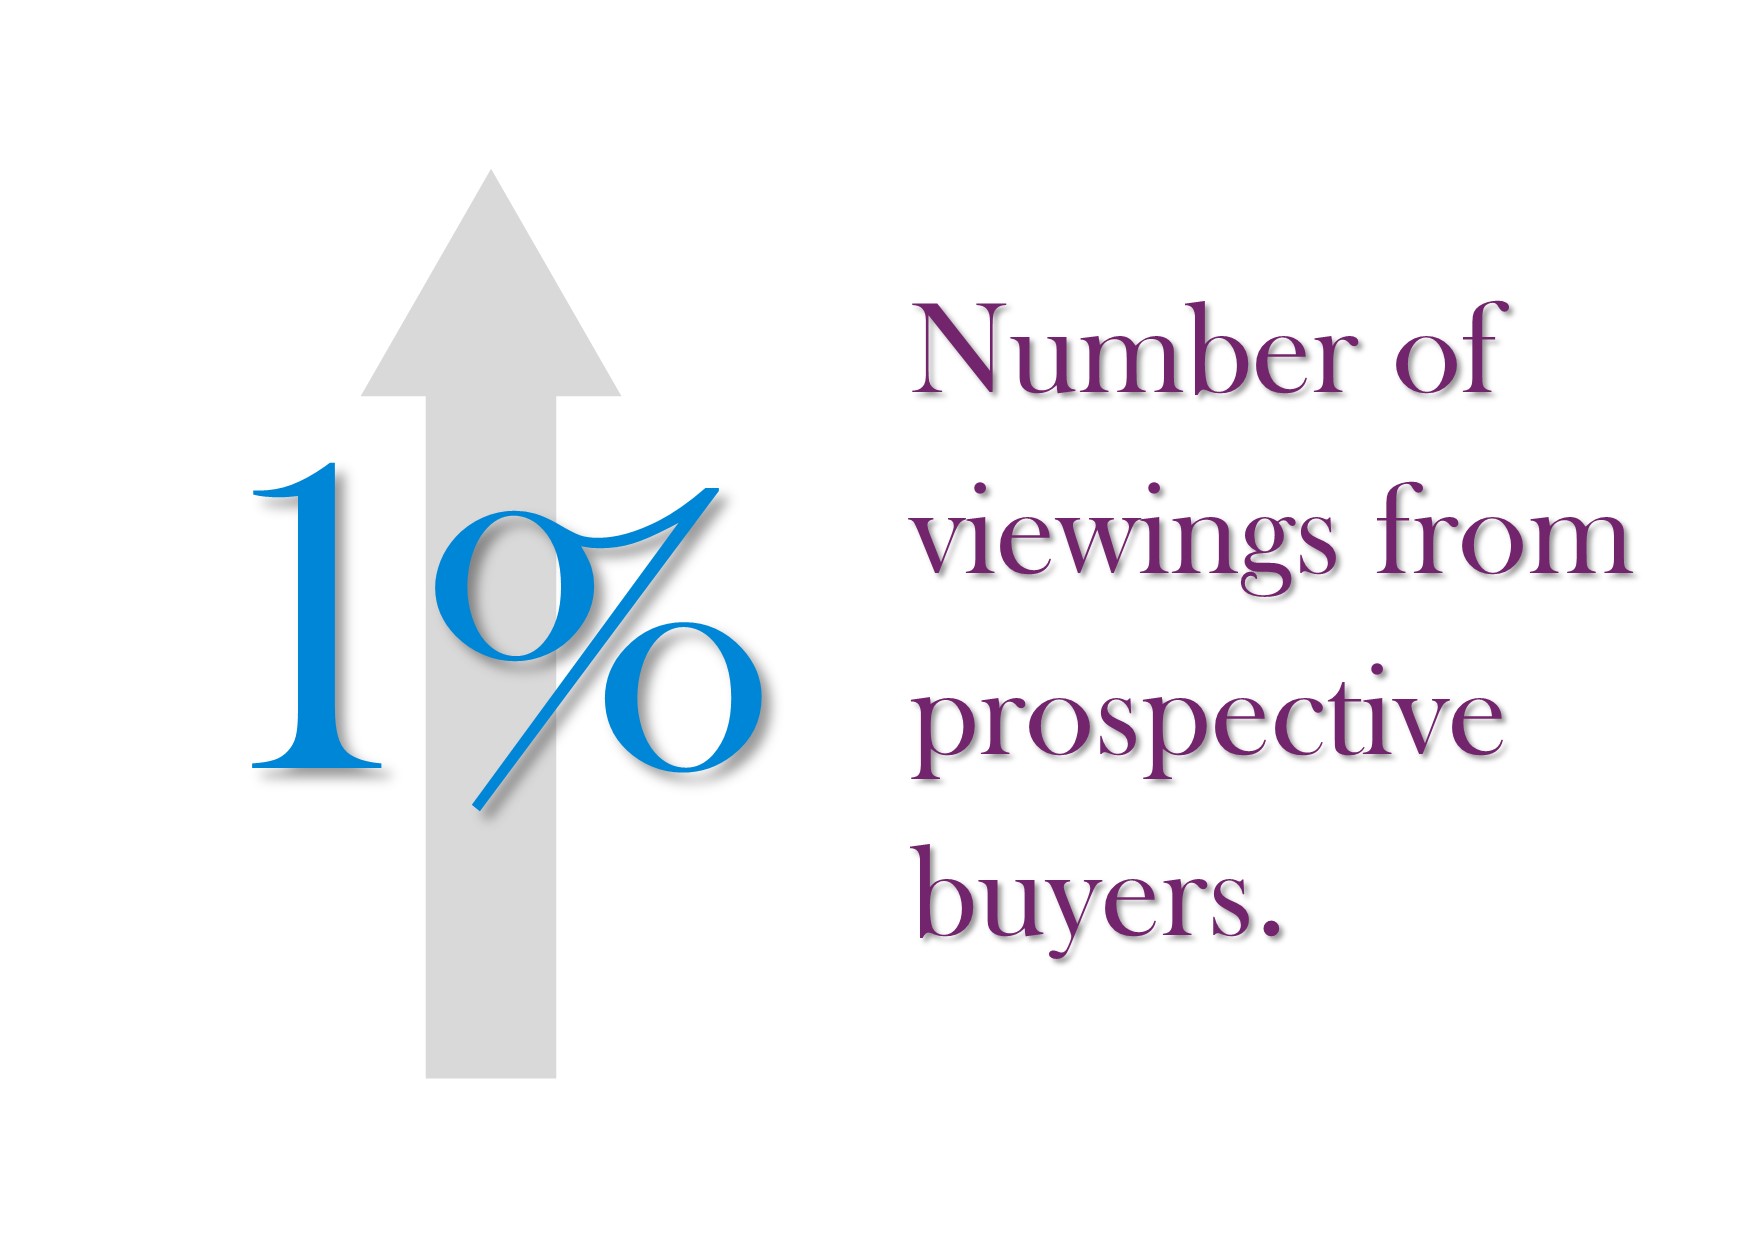
For practical purposes there is no real change here, this does however mean that a higher percentage of buyers that are out viewing, are making offers. It is more important than ever to ensure that the number of feet through the door from potential buyers remains high as this will dramatically increase your chances of securing a buyer and will help create a sense of urgency that will help you achieve the best possible price. In essence you should price your property to entice viewings and leverage negotiation against other interest as opposed to just stating what you want for your property as a seller, as this carries a lot more weight!
If you are thinking of selling and would like an idea on the current value of your home, you can use our FREE instant valuation tool below for an instant estimation. Additionally, if you have been on the market without success and would like to discuss other available strategies for selling your property, please call our Molesey team on 0208 396 6717 or email molesey@newtonhuxley.co.uk
GET AN INSTANT PROPERTY VALUATION FOR FREE!

The "B" word is firmly placed into our vocabulary, but what is happening in the local Molesey property market in the run up to Brexit?
If you don't have the time to read all of this article, here are our key points.
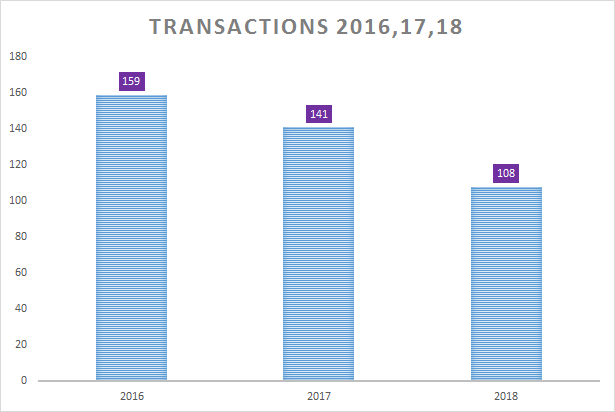
- Transaction levels have decreased in Molesey by 23.4% in the last 12 months.
- Real-time property values for Terraced and Semi-Detached homes in Molesey have increased by 0.6% (£3500 average).
- Asking prices in Molesey have increased by 9%.
- Asking prices in SW London have decreased by -18%.
- Asking prices in neighbouring towns are currently representing better value having acknowledged adjustment in the market.
- Increase in asking prices likely cause of slow down in transactions.
- Brexit has created some uncertainty from sellers which has restricted supply.
- Low interest rates and consistent demand for Surrey commuter towns has maintained a strong market.
- Stamp Duty changes and affordability concerns greater than those regarding Brexit.
Here's how Molesey asking prices compare to neighbouring towns that are equally as popular with buyers moving out of London.
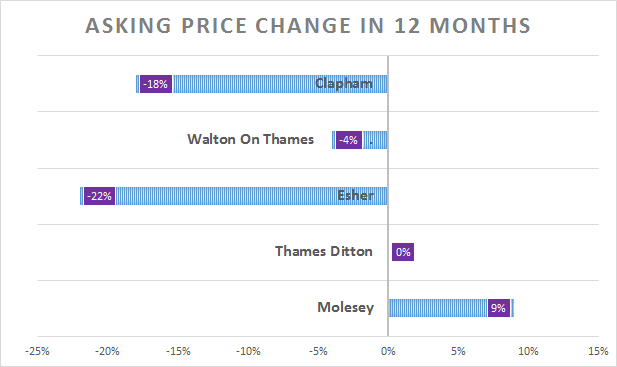
Could this mean that transaction levels are being unneccesarily supressed by an uncompetitive increase in asking prices in Molesey when compared to neighbouring towns?
Want to get stuck into the nitty gritty? Let's get started.
Below is specific data collected from Land Registry archives, showing the average price paid, and the number of completed transactions for semi detached, and terraced properties in the KT8 postcode area. Each graph includes data between 1st January and 23rd October for each year so that we are able to compare to the current market with greater accuracy.
TOTAL TRANSACTIONS IN MOLESEY 2016, 17, 18 – 1st January – 23rd October.
AVERAGE PRICE PAID (£) FOR A SEMI DETACHED OR TERRACED PROPERTY IN MOLESEY
2016,17,18 – 1st January – 23rd October.
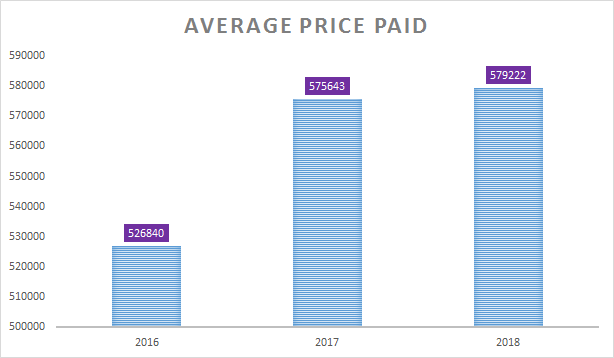
What does this data mean?
From a transactional point of view, we have seen a sharp decrease in the amount of completed transactions compared to last year, yet prices have increased by just over £3500. This is expected with a reduced supply so nothing particularly unusual there.
By reading headlines in the media, you would be lead to believe the property market is in a terrible state, and Mark Carney, Governor of the Bank of England has claimed a potential value drop of up to 35%! We of course completely disagree with this estimation. To try and bring things back to reality we have compared this data with the period before and after the GLOBAL recession in 2008.
TOTAL TRANSACTIONS IN MOLESEY 2007, 8, 9 – 1st January – 23rd October.
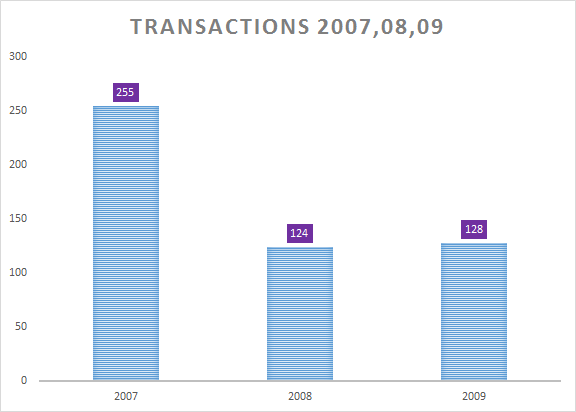
AVERAGE PRICE PAID (£) FOR A SEMI DETACHED OR TERRACED PROPERTY IN MOLESEY
2007,8,9 – 1st January – 23rd October.
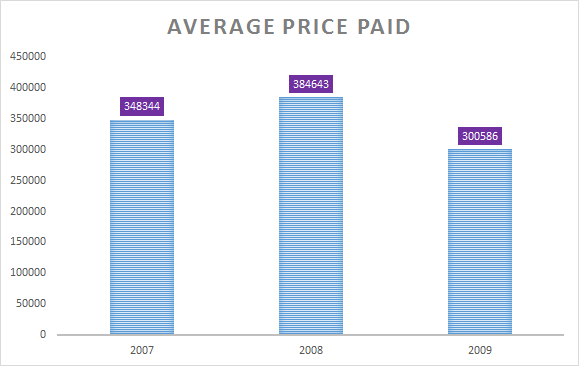
Comparisons between the current market, and the global recession of 2008.
Aside from the fact that property values in Molesey have on average increased by 48% since 2009, we can see that already, transaction levels are lower right now than they were in 2008/09. Average prices for semi detached and terraced properties in Molesey decreased by 22% (approx. £84,000), given the banks were in crisis mode and the whole world was experiencing a financial meltdown, this is not difficult to understand.
This is just our own opinion, but we cannot find any reasonable prediction that would conclude the value of property in the UK will be worse affected due to Brexit. The cost of borrowing is still at an exceptionally low level, so the demand is there but the affordabilty has hit its current ceiling, especially with the change in stamp duty bandings that has slowed movement at the upper end of the market.
The London Market.
Surrey's property market and consistently high performance in terms of transactions and value, is largely due to the ever increasing migration from buyers moving out of South West London. Whenever we are looking for insight into the local market in Molesey, we look at what is happening in driver towns in SW. For this example, we have used Clapham (SW4) as a comparable, to show how it stacks up against local areas, with Molesey of course being our main focus.
Transaction and property values are being affected in a similar way in SW4, as they are accross SW London. So in the present market, Surrey commuter towns like Molesey need to remain competitive. It is no secret the the London market relies on foreign investment to maintain a trend of property values increasing, but as the ripple effect into Surrey takes place, this has not translated into values taking a nose dive, they just aren't jumping up in the same way that we have grown acustomed to.
THINKING OF SELLING OR ALREADY ON THE MARKET WITHOUT SUCCESS?
CALL YOUR MOLESEY MARKET EXPERTS ON
0208 396 6717.
FIND THE CURRENT VALUE OF YOUR OWN PROPERTY IN 60 SECONDS HERE.
If you're a homeowner in Molesey, you'll be interested in the current value of your home. If you're looking to up or down size, and plan to stay local, you'll be interested in the current value of property on some of your favourite streets!
The list below shows the increase in value over the last 5 years, as well as the number of transactions over the last 12 months to give you an idea of how often property becomes available to buy in any given road.
If you would like an instant valuation of your own home, this handy instant valuation tool is completely free and will give you an immediate indication as to your properties current value

Road Name |
Price Change 5 years (+) |
Current Average Value £ |
Number of sales last 12 months |
| Rivermead | 555,316.00 | 1,125,994.00 | 1 |
| Harrow Gardens | 440,740.00 | 1,943,811.00 | 0 |
| Spencer Road | 436,911.00 | 1,926,926.00 | 1 |
| Arnison Road | 405,761.00 | 1,789,542.00 | 0 |
| Wolsey Road | 384,894.00 | 1,697,498.00 | 2 |
| Church Road | 375,389.00 | 1,655,595.00 | 0 |
| Palace Road | 351,571.00 | 1,550,545.00 | 4 |
| Hansler Grove | 347,510.00 | 1,532,631.00 | 1 |
| Vine Road | 332,602.00 | 1,466,880.00 | 0 |
| The Wilderness | 323,089.00 | 1,424,912.00 | 0 |
| The Riverside | 322,168.00 | 1,420,846.00 | 1 |
| St Johns Road | 312,721.00 | 1,379,196.00 | 0 |
| Kent Road | 308,844.00 | 1,362,082.00 | 2 |
| Beauchamp Road, KT8 0PA | 296,920.00 | 1,309,496.00 | 0 |
| Matham Road | 293,915.00 | 1,296,232.00 | 1 |
| Seymour Road | 276,458.00 | 1,219,254.00 | 1 |
| Hampton Court Crescent | 251,841.00 | 1,110,679.00 | 0 |
| Manor Road | 248,149.00 | 1,094,385.00 | 2 |
| Hurst Road | 244,939.00 | 1,080,230.00 | 8 |
| Hampton Court Road | 243,871.00 | 1,075,515.00 | 6 |
| Ember Lane | 239,680.00 | 1,057,032.00 | 0 |
| Molember Road | 234,291.00 | 1,033,254.00 | 0 |
| Grove Road | 224,022.00 | 987,973.00 | 0 |
| Ember Farm Avenue | 221,899.00 | 978,610.00 | 0 |
| Broadfields | 219,460.00 | 967,833.00 | 1 |
| Clinton Avenue | 217,167.00 | 957,727.00 | 1 |
| Ember Farm Way | 206,667.00 | 911,403.00 | 1 |
| Southfields | 205,744.00 | 907,347.00 | 1 |
| Parsons Mead | 202,956.00 | 895,043.00 | 1 |
| Hidden Close | 201,747.00 | 889,710.00 | 0 |
| Park Road | 201,725.00 | 889,626.00 | 3 |
| St Marys Road | 197,236.00 | 869,825.00 | 1 |
| Field Close | 196,826.00 | 868,015.00 | 1 |
| Molesey Park Close | 195,095.00 | 860,385.00 | 0 |
| River Bank | 194,206.00 | 856,467.00 | 1 |
| Feltham Avenue | 193,227.00 | 852,146.00 | 4 |
| Molesey Park Road | 193,077.00 | 851,498.00 | 1 |
| Riverside Avenue | 193,075.00 | 851,475.00 | 0 |
| Summer Avenue | 192,479.00 | 848,848.00 | 0 |
| Gladstone Place | 191,339.00 | 843,799.00 | 0 |
| Summer Gardens | 190,978.00 | 842,218.00 | 0 |
| Cedar Close | 179,814.00 | 792,979.00 | 0 |
| Esher Road | 178,588.00 | 787,583.00 | 5 |
| Cedar Road | 178,295.00 | 786,278.00 | 0 |
| Orchard Lane | 176,235.00 | 777,199.00 | 0 |
| Bridge Gardens | 171,336.00 | 755,588.00 | 0 |
| Summer Road | 167,554.00 | 738,909.00 | 3 |
| Cherry Orchard Gardens | 164,513.00 | 725,496.00 | 2 |
| Knights Close | 162,046.00 | 714,615.00 | 0 |
| Mole Abbey Gardens | 158,695.00 | 699,826.00 | 1 |
| Hampton Court Avenue | 154,042.00 | 679,314.00 | 1 |
| Nightingale Road | 150,204.00 | 662,380.00 | 0 |
| Hollingworth Close | 148,171.00 | 653,415.00 | 1 |
| Langton Road | 147,817.00 | 651,866.00 | 2 |
| Seymour Close | 146,355.00 | 645,407.00 | 0 |
| Pemberton Road | 144,745.00 | 638,309.00 | 1 |
| Hampton Court Way | 143,375.00 | 632,270.00 | 0 |
| Queens Reach | 143,311.00 | 631,977.00 | 1 |
| Augusta Close | 142,369.00 | 627,823.00 | 0 |
| Ash Island | 141,855.00 | 625,559.00 | 0 |
| Avern Gardens | 141,855.00 | 625,559.00 | 0 |
| Carleton Avenue | 141,855.00 | 625,559.00 | 0 |
| Graburn Way | 141,855.00 | 625,559.00 | 0 |
| Island Farm Avenue | 141,855.00 | 625,559.00 | 0 |
| Orchard Farm Avenue | 141,855.00 | 625,559.00 | 0 |
| Dunstall Way | 141,583.00 | 624,357.00 | 1 |
| Oarsman Place | 140,120.00 | 617,899.00 | 0 |
| Weston Avenue | 138,519.00 | 610,844.00 | 0 |
| New Road | 138,390.00 | 610,285.00 | 1 |
| Winchilsea Crescent | 138,087.00 | 608,341.00 | 0 |
| Cherry Orchard Road | 137,649.00 | 607,009.00 | 1 |
| Alders Grove | 137,513.00 | 606,401.00 | 0 |
| Sandringham Gardens | 137,168.00 | 604,881.00 | 0 |
| Garrick Gardens | 135,967.00 | 599,595.00 | 0 |
| Dennis Road | 135,279.00 | 596,552.00 | 2 |
| Mole Place | 135,064.00 | 595,609.00 | 0 |
| Churchfields | 134,392.00 | 592,626.00 | 1 |
| Park Way | 129,954.00 | 573,056.00 | 0 |
| Windsor Avenue | 127,266.00 | 561,208.00 | 1 |
| Hurst Lane | 127,136.00 | 560,639.00 | 3 |
| The Crescent | 125,726.00 | 554,414.00 | 0 |
| Balmoral Crescent | 125,675.00 | 554,200.00 | 3 |
| Molesey Park Avenue | 122,726.00 | 541,171.00 | 0 |
| Cannon Way | 120,481.00 | 531,284.00 | 1 |
| Creek Road | 120,366.00 | 530,770.00 | 0 |
| Freeman Drive | 119,689.00 | 527,800.00 | 0 |
| Adecroft Way | 119,168.00 | 525,506.00 | 0 |
| Minster Gardens | 118,278.00 | 521,577.00 | 0 |
| Helen Close | 116,014.00 | 511,576.00 | 0 |
| Challoners Close | 115,894.00 | 511,038.00 | 0 |
| Molesey Road | 115,479.00 | 509,214.00 | 3 |
| Monaveen Gardens | 115,071.00 | 507,412.00 | 1 |
| Avern Road | 113,954.00 | 502,497.00 | 1 |
| Merton Way | 113,761.00 | 501,650.00 | 3 |
| Green Lane | 113,379.00 | 499,971.00 | 1 |
| Creek Cottages | 113,071.00 | 498,598.00 | 0 |
| School Road | 110,879.00 | 488,954.00 | 2 |
| Bridge Road | 110,426.00 | 486,936.00 | 11 |
| Third Close | 110,020.00 | 485,133.00 | 0 |
| Redland Gardens | 109,303.00 | 481,970.00 | 0 |
| Buckingham Gardens | 108,520.00 | 478,514.00 | 4 |
| Bell Road | 108,115.00 | 476,739.00 | 3 |
| Lytcott Drive | 107,819.00 | 475,438.00 | 2 |
| Faraday Road | 107,807.00 | 475,389.00 | 2 |
| Ivydene | 107,573.00 | 474,466.00 | 1 |
| Rosemary Avenue | 107,568.00 | 474,345.00 | 1 |
| Thames Meadow | 107,447.00 | 473,796.00 | 0 |
| Beauchamp Road | 106,722.00 | 470,596.00 | 2 |
| St Peters Road | 105,208.00 | 463,915.00 | 0 |
| Cherimoya Gardens | 105,095.00 | 463,426.00 | 1 |
| Buckingham Avenue | 105,073.00 | 463,325.00 | 3 |
| Monks Avenue | 104,991.00 | 462,658.00 | 4 |
| Pool Road | 104,846.00 | 462,318.00 | 0 |
| Anne Way | 103,561.00 | 456,644.00 | 1 |
| Fleet Close | 102,943.00 | 453,935.00 | 0 |
| Kings Chase | 102,940.00 | 453,910.00 | 4 |
| Spring Gardens | 102,823.00 | 453,403.00 | 3 |
| Hotham Close | 102,468.00 | 451,836.00 | 0 |
| Bedster Gardens | 101,008.00 | 445,401.00 | 3 |
| Grafton Way | 100,968.00 | 445,219.00 | 3 |
| Linkfield | 100,819.00 | 444,558.00 | 1 |
| Chalford Close | 100,771.00 | 444,343.00 | 2 |
| The Dene | 100,619.00 | 443,690.00 | 2 |
| Molesham Close | 98,773.00 | 435,537.00 | 0 |
| Beldham Gardens | 98,244.00 | 433,208.00 | 0 |
| Dunvegan Close | 97,571.00 | 430,240.00 | 0 |
| Priory Lane | 97,521.00 | 430,027.00 | 2 |
| Boleyn Drive | 96,999.00 | 427,722.00 | 0 |
| Apps Meadow Close | 96,730.00 | 426,517.00 | 0 |
| Molesham Way | 96,386.00 | 425,021.00 | 2 |
| Tufton Gardens | 95,936.00 | 423,023.00 | 2 |
| Victoria Close | 95,245.00 | 419,989.00 | 0 |
| Faraday Place | 93,719.00 | 413,246.00 | 0 |
| The Forum | 93,279.00 | 411,312.00 | 0 |
| Dundas Gardens | 92,048.00 | 405,868.00 | 1 |
| Second Close | 91,938.00 | 405,401.00 | 0 |
| Bishop Fox Way | 91,748.00 | 404,543.00 | 0 |
| Berkeley Drive | 91,594.00 | 403,974.00 | 1 |
| Sadlers Ride | 91,543.00 | 403,645.00 | 1 |
| Kelvinbrook | 91,206.00 | 402,165.00 | 5 |
| Tonbridge Road | 90,549.00 | 399,259.00 | 0 |
| St Barnabas Gardens | 89,401.00 | 394,202.00 | 1 |
| Chandlers Close | 88,407.00 | 389,815.00 | 0 |
| Central Avenue | 88,089.00 | 388,421.00 | 1 |
| Brockenhurst | 87,585.00 | 386,195.00 | 0 |
| Walton Road | 87,399.00 | 385,372.00 | 3 |
| Island Farm Road | 87,320.00 | 385,020.00 | 0 |
| Fleetside | 85,496.00 | 376,987.00 | 9 |
| Spurfield | 84,838.00 | 374,071.00 | 1 |
| Spreighton Road | 84,823.00 | 374,016.00 | 1 |
| Rupert Court | 83,020.00 | 366,056.00 | 1 |
| Weldon Drive | 81,602.00 | 359,804.00 | 0 |
| Grange Road | 81,427.00 | 359,045.00 | 3 |
| High Street | 81,398.00 | 358,897.00 | 3 |
| Victoria Avenue | 80,377.00 | 354,404.00 | 2 |
| Odard Road | 79,706.00 | 351,453.00 | 0 |
| Belvedere Gardens | 78,494.00 | 346,072.00 | 2 |
| Approach Road | 76,115.00 | 335,598.00 | 0 |
| Ray Road | 75,613.00 | 333,385.00 | 0 |
| Dunstable Road | 74,748.00 | 329,568.00 | 0 |
| Upper Farm Road | 74,686.00 | 329,306.00 | 1 |
| First Close | 74,576.00 | 328,813.00 | 1 |
| Down Street | 74,458.00 | 328,293.00 | 2 |
| The Fairway | 74,320.00 | 327,692.00 | 0 |
| Carlyle Close | 73,739.00 | 325,122.00 | 2 |
| First Avenue | 73,396.00 | 323,615.00 | 3 |
| Glebelands | 73,067.00 | 322,158.00 | 1 |
| Mountwood | 72,527.00 | 319,793.00 | 3 |
| Wilton Gardens | 72,375.00 | 319,106.00 | 1 |
| Brende Gardens | 70,953.00 | 312,890.00 | 1 |
| Coppsfield | 70,422.00 | 310,481.00 | 0 |
| Grange Close | 70,185.00 | 309,442.00 | 1 |
| Manor Court, High Street | 69,378.00 | 305,883.00 | 0 |
| Cambridge Road | 68,752.00 | 303,124.00 | 0 |
| Molesey Avenue | 68,540.00 | 302,185.00 | 1 |
| Eastcote Avenue | 67,823.00 | 296,656.00 | 4 |
| Hampton Court Parade | 66,258.00 | 292,132.00 | 1 |
| Yeend Close | 63,297.00 | 279,064.00 | 0 |
| Palmers Grove | 62,798.00 | 276,798.00 | 0 |
| Grovelands | 59,903.00 | 264,088.00 | 3 |
| Pool Close | 58,023.00 | 255,799.00 | 2 |
| Central Parade | 57,883.00 | 255,180.00 | 0 |
As a whole, property values in Molesey have increased by £160,549.76 on average in the last 5 years, with the current average proeprty value in the area at £630,572.09.
If you are considering moving on to the next chapter of your life and would like to book a free market appraisal of your home, please click the link below, alternatively you can obtain a quick online valuation here.


You may be thinking of moving, or more likely, you are just interested to know if the value of your property has gone up or down. It can be really difficult to guage what is happening with property values, some estate agents are always talking up the market, and the media is generally extremely negative and apocalyptic about the housing market around Surrey and London.
Let us cut out the rhetoric and the "sales spiel" and get down to some undeniable cold hard facts!
Transaction Levels
For most of us, it feels like 2008 was only yesterday, the recession hit and transaction levels went through the floor. As an example, the KT10 postcode area (Esher, Claygate, Hinchley Wood) dropped from over 400 annual transactions to just 184. Since then transactions have increased until the most recent peak in 2013 of 446 total transactions. There has been a steady decline in the number of transactions since then, and in 2017 the Land Registry recorded 354 transactions across Esher, Claygate and Hinchley Wood. The level of transactions has declined by 21% since the most recent peak in 2013, but has increased by 4% over the last year. Hardly a disaster story and by contrast to 2008 levels, a very healthy market place indeed.
A similar story applies to areas like Molesey and Thames Ditton, with transaction levels down 21% over a similar period, and still way above 2008 levels.There really is no comparison to the 2008 recession that has been quoted by some of the more dramatic media sources. To sum up, we are not at the "height" of a market trend but we predict prices to remain where they are for the next 2-3 years with modest fluctuations of around 5% +/- throughout this period.
Property Values
So you know transaction levels are still high, just not as high as they’ve been before, and we know what we're all really interested in… The value of property!
Last year property values across Molesey, Esher, Claygate, Hinchley Wood and Thames Ditton slipped slightly, with the lower end of the market dipping around 5% and the £1m + market dipping by 7% or more. This was purely down to affordability issues and scepticism from would be buyers. As a company, we experienced a market where buyers wanted to buy with interest rates at an all-time low, but sellers were still hoping for record breaking prices creating a gap that either the seller, or the buyer needed to fill. As the consumer dictates the price of a product by demand, this quickly formed a "buyers’ market" mentality, but once asking prices were adjusted, there were plenty of buyers for every property as they jumped at the chance to secure a reasonably priced home.
Since the beginning of 2018, house values have increased across all of the areas we cover: KT10 by 5%, KT8 by 3.14% and KT7 by 5.43%, this shows that the adjustment in asking prices last year from the majority of sellers created more competition from buyers and therefore, persuaded buyers to part with (or borrow) more cash to purchase their next home.
What we are still seeing is an extremely price sensitive marketplace, overestimating your property's value or listing with an agent purely because they provided you with a surprisingly high and intoxicating valuation, can cost you in the long run. Where properties remain on the market for longer than expected, buyers will assume you are desperate to sell and we have in extreme cases, received offers 15% below asking price. This will hinder your chances of getting market value and will make it nearly impossible for your agent to negotiate the best possible price for your property. Correct asking price = hordes of buyers = multiple offers = best price AND best position to proceed.
If you are thinking of selling, look at the sold history in your area on either Rightmove, Zoopla or Land Registry, asking prices are not always, what a property will sell for. Check how long a property has been on the market for, ask yourself why it hasn't sold if it has been on the market for months. Get multiple valuations from agents who have a good record of accomplishment in your area, listen to the facts and evidence rather than just listening to what you hope to hear. In an age where "fake news" has penetrated the majority of information sources, only the facts and evidence that you can verify matter, and that is all a buyer will consider – unless they fall in love with your property and have to submit a sealed bid because there are multiple interested parties! They are more likely to consult their mortgage broker than sold data at that stage!
If you are thinking of selling, would like clear advice on the value of your home and the best marketing strategy to adopt when and if you decide to sell, please call our sales team on either 0208 396 6717 or 01372 631 622 for more information. Alternatively, you can book a FREE valuation by clicking the link below.
BOOK A VALUATION
It's not long until #LoveMolesey and the team are busy finalising details for a huge range of projects. So far they already have cleanup projects, opportunities to make a difference in our local schools, care homes and the day centre, tea parties for seniors, a fun games night for young people and even a history walk along the towpath. Over the coming weeks they'll be announcing lots of others so keep checking the website www.lovemolesey.org to find out more.
On Tuesday 13th March they'll be holding their launch event, during which you will have the opportunity to hear from the organising team all about the vision behind #LoveMolesey and what’s coming up. You will also have the chance to meet many of the team leaders to learn more about the different projects which will be running over the course of the 4 weeks and how you can get involved. Refreshments will be available, we look forward to seeing you there!

If you already live in Molesey, you already know where Musicland East is. We were lucky enough to have a chat with owner James Etherington to talk about Musicland East, Molesey, and what keeps him in love with music and teaching.

Yes that is a chrome guitar, and yes the only other time you may have seen one like it was on the cover of Brothers In Arms by Dire Straits!

The shop has an extremely welcoming feel, and you are instantly greeted by some amazing instruments (and musicians).

The workbench where James repairs and maintains instruments.
As soon as you enter the shop your are welcomed by the relaxed and unpolished vibe that is clearly perfect for the creative nature of teaching and experimenting with music. There is an array of stringed instruments that line the walls, along with amplifiers, straps, leads and retro festival posters amongst other things. The entire building is charming, even down to the work bench where James repairs and maintains their customer's instruments.

One of the teaching rooms at Musicland East, just look at those posters! How could you not be inspired!

Thats right. Thats a guitar made around a motor oil can. They are even cooler in real life!
Whilst there is a clear emphasis on the technical and theoretical side of music, the teaching/ practise rooms continue the relaxed vibes within the shop, and the staff have a superb knowledge of their respective crafts. This makes for a perfect, pressure free learning environment for any aspiring musicians, whether it be guitar, piano, or drums, this has to be one of the most charming and inspirational places to learn.

We asked James a few questions whilst we were there, we hope you enjoy reading what he had to say, and we've included contact details at the end of this article in case you want to start (or continue!) a passion for music at Musicland East.
How long has Musicland East been in Molesey for?
Since 1996, so about 22 years on the corner of Matham Road and Walton Road.

What services and products do you offer?
We do a lot of teaching here, with guitar, bass, drums, piano and ukelele lessons going seven days a week, out of four teaching rooms. We also stock new and second hand instruments and accessories, and I carry out repairs and setups on string instruments on site as well.

What is it that you like about working in Molesey and the general community?
The people are cool and really get behind stuff. There's quite a few open mic nights in the area and we've had a massive response to our larger Musicland Live events, which give our students the opportunity to get together into bands and have them perform on a proper stage and gain some experience. Its' a great evening and we always sell hundreds of tickets, and it can only grow off the back of the community that supports it. Luckily, Molesey has a great one!

What's your top tip for someone looking to get into music/learning an instrument?
Get a reasonable instrument but don't break the bank yet, make sure it's set up and tuned correctly, and play everyday for the love of it so you advance naturally. My main instrument is the guitar and there's such a range of approaches and styles you can play in and so much advice out there, but play the music you love to hear and you'll be on the right track.

What is your favourite thing about your job?
We get a real opportunity to make a difference. The shop meant a lot to me growing up, and I can see it means a lot to some of our younger students now. The community atmosphere gives way to the tendency to dream big, and it's great to have a shop full of musicians and those who support them, seven days a week, in a community that lets it thrive.

Musicland East
52-54 Walton Road, East Molesey, Surrey, KT8 0DL
0208 979 9443
musiclandeast@hotmail.com

The current property drought is nationwide, with the average price of a property sold subject to contract in the UK in September at £221,797. On top of that, the supply of properties for sale is 14.3% down compared to 12 months prior, and 3.1% from August this year.
New instructions are also down 18.5% in London, where the average house price last month was £521,383.
Buyer activity is being magnified, with new buyer registrations up 8.4% annually, in particular the number of new first-time buyer registrations is up 7.4% with the current low mortgage rates.
What does this mean for the East and West Molesey property market?
Already we have seen a spike in new buyer registrations with many homes going under offer with the first seven days of marketing, and on average we are acheiving 98% of asking prices. A sure sign that there are more buyers per property.
The affect this has had on the Molesey property market is great news for those planning to sell in the near future. In the past 6 months property prices in East and West Molesey have increased by £15,583 on avg (2.86%), with 117 transactions in the KT8 postcode area in the same time period.
For the first 6 months of 2015 there were 164 transactions which shows a drop in completed sales of around 28%. It is no wonder then that as the amount of new buyers searching for a home increases, and new instructions coming to market dropping, property prices have increased significantly.
This bubble will burst when mortgage rates rise and there are numerous reports that suggest this will happen in the not too distant future, when this happens we anticipate buyer activity will decrease and property values will level off temporairily. We therefor urge anyone considering selling to take advantage of the current market and to bring any plans to sell forward where possible.
Should you require a valuation and market appraisal of your home our appointments are offered free of charge and without obligation. Please contact our sales team on 0208 396 6717 to arrange your appointment.

Sam Kamali | Sales Director
07957 301 214 | sam@newtonhuxley.co.uk
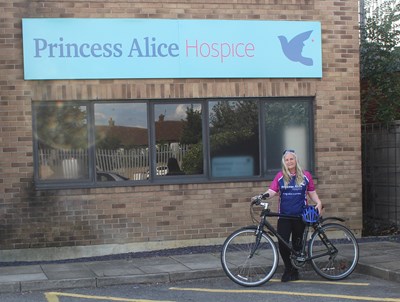
Will you show your support? Karen Lamb of West Molesey is fundraising for the Princess Alice Hospice with a target of £3000. She has already raised nearly £500.00 of her target and is training hard. Her heart felt story of what inspired her to take on this challenge is below along with details of how to donate.
"Three years ago, my partner Mike and I were leading a normal, happy life together when everything changed. Mike was diagnosed with esophageal cancer at the age of 50. Three weeks later, on New Year’s Eve, he died.
Mike didn’t have the chance to benefit from the wonderful care of the Princess Alice Hospice. I want to raise money so that this care is available to as many people as possible who find themselves in a similar position.
My name is Karen, I am 48 years old and I work in the Retail Department of Princess Alice Hospice.
A few months ago, the only reason I would get on my bike was to cycle to the pub! Now I’m training to do a 10 day, 500km cycle from Vietnam to Cambodia.
If you’d like to help me to achieve my goal, please donate whatever you can to this wonderful organisation.
Thank you for taking the time to read my story."
Karen
If you would like to make a donation please visit: https://www.justgiving.com/Karensbikechallenge/
Best of luck Karen!
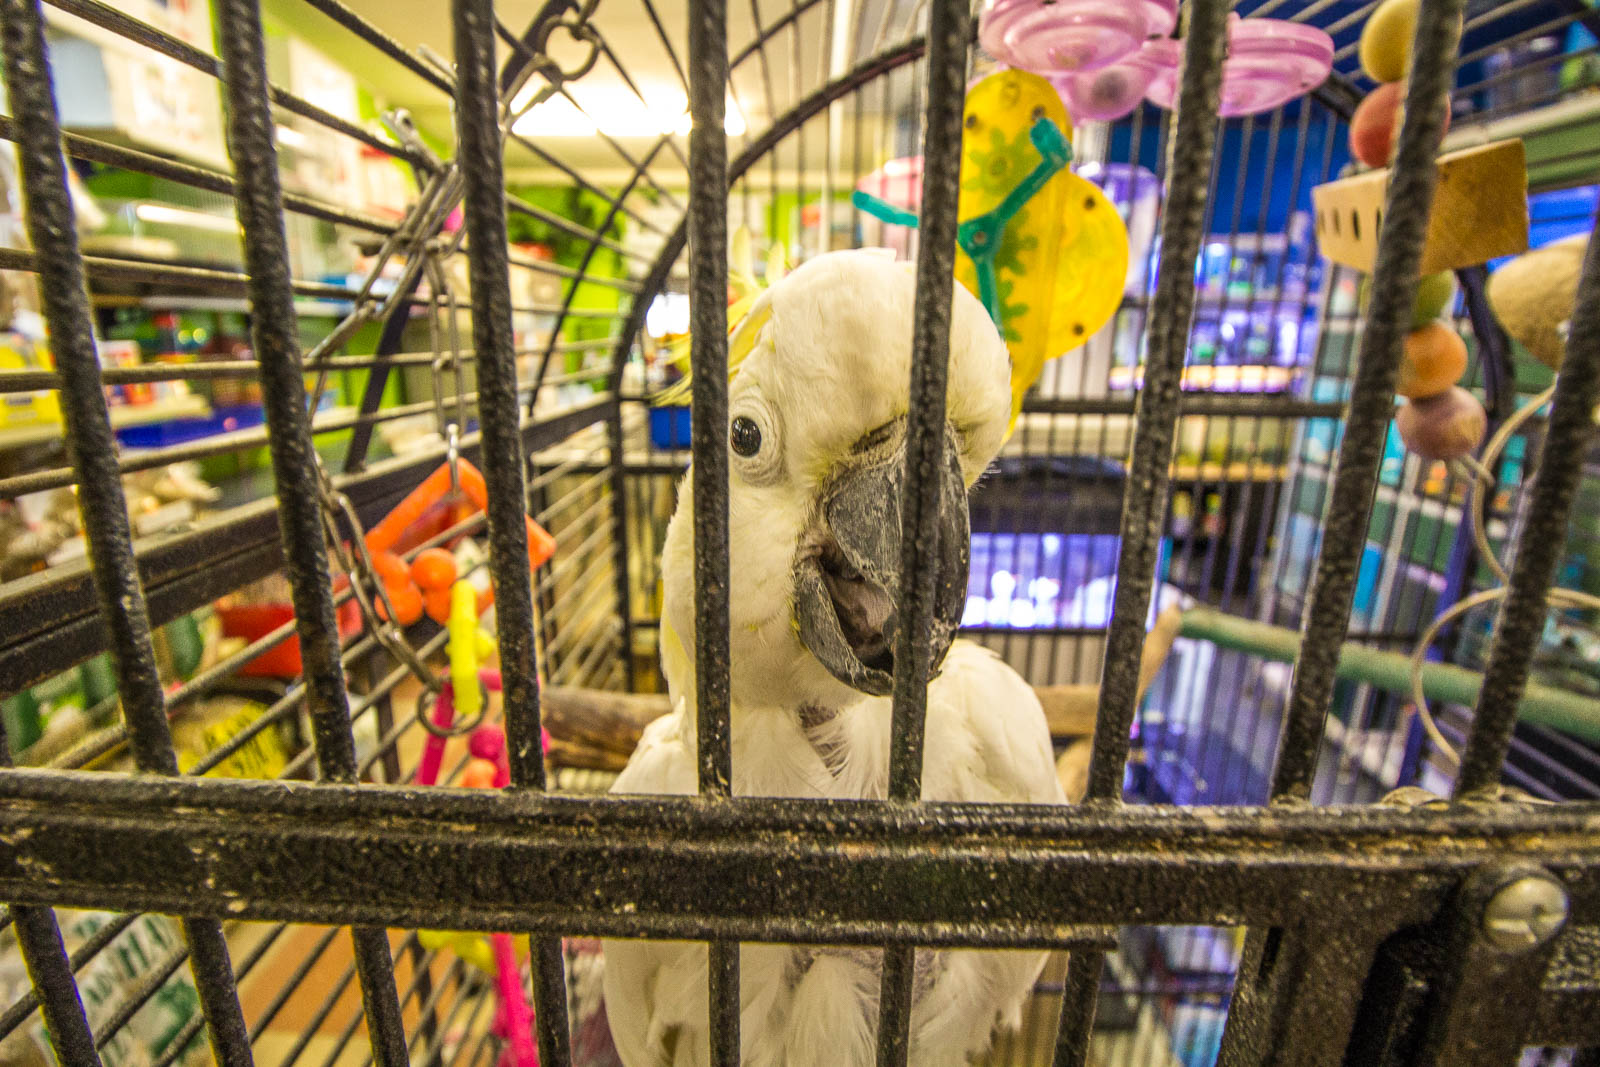
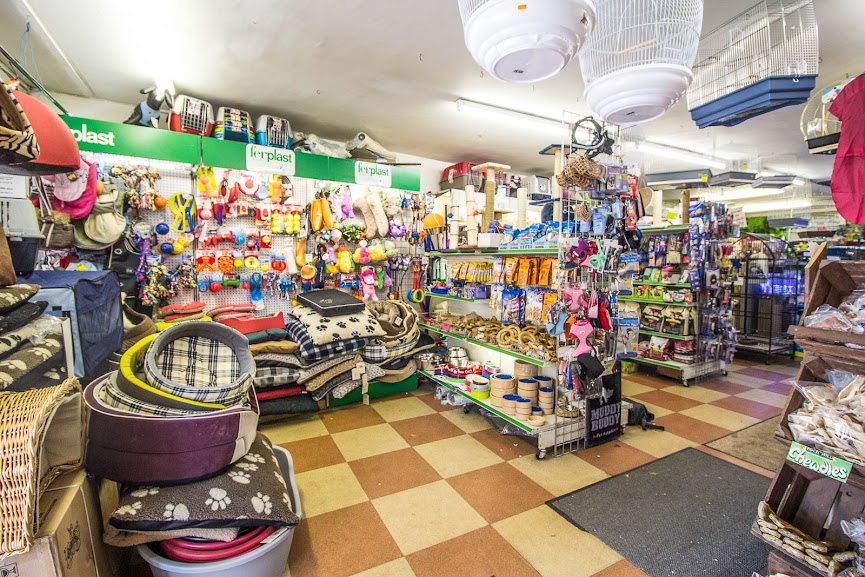
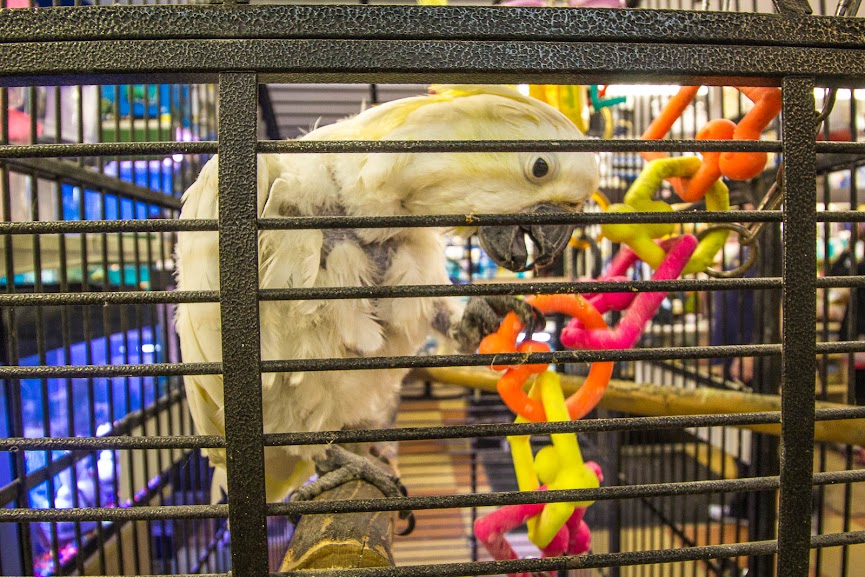
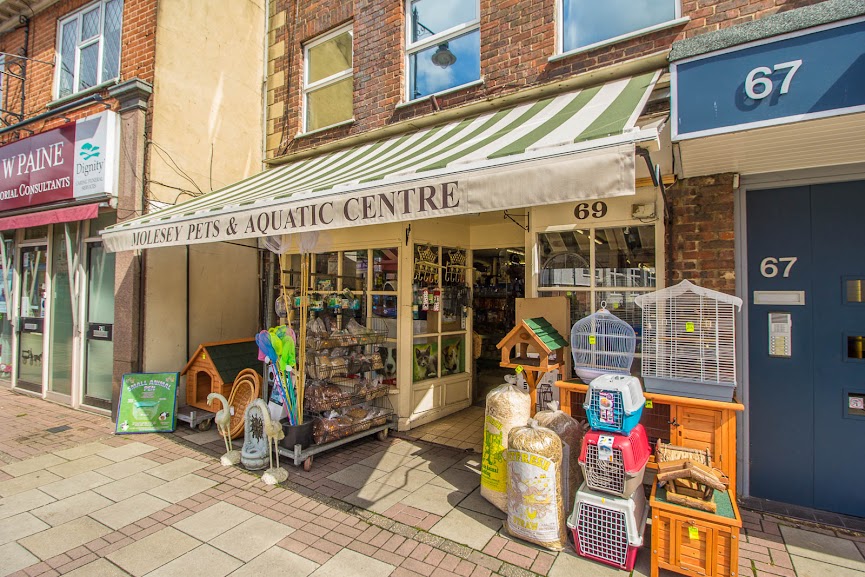
If you live in Molesey, you'll know about Molesey Pets and Aquatic Centre. Here's what owner Paul Davidson told us about his locally renowned pet shop.

What does the Molesey Pets and Aquatic Centre offer to Molesey residents?
Everything to do with your pet or aquatic needs. We also offer an outdoor aquatic service which includes ponds and water features etc.
How long have you been trading for?
40 years! I was born in Molesey and my family has always had businesses here.

Who runs the shop on a day to day basis?
I do all of the leg work, Chris the Cockatoo takes on more of a "meet and greet" role with the customers.
What do you like most about Molesey?
It's still a village, so many areas close by are built up and have changed dramatically where as Molesey has retained its community feel.
Have a pet/pond related query? Contact Paul via the details below:
Molesey Pets and Aquatic Centre, 69 Walton Road, East Molesey, Surrey, KT8 0DP
Tel: 0208 979 9083
moleseypets@gmail.com
Want to feature your business in Molesey? Contact us or call 0208 396 6717.
Elevating the Elmbridge property market
Visit us in Molesey
East Molesey
Surrey
KT8 9ER
VISIT US IN ESHER
Claygate
Esher
Surrey
KT10 0PD