For many homeowners waiting for the right time to move, it has been a difficult decision to make for the past few years. The property market in the UK has been subject to an onslaught of market slowing events with what feels like endless elections, the EU referendum, changes to stamp duty land tax, and then this year to top it all off, the world was pretty much shut down by a coronavirus pandemic from COVID-19.
As soon as the property market was put on pause, the headlines wrote themselves, and the media reported that the property market apocalypse was approaching… but it never arrived.
Then, as the property market opened again, we were warned about how tough it was going to be to sell our properties, so was this prediction right?
Let’s take a look at what the data tells us…
The below graph is taken from Rightmove data for the KT7, KT8 and KT10 postcodes which covers Thames Ditton, East and West Molesey, Hinchley Wood, Claygate and Esher (where Newton Huxley sell the most properties).
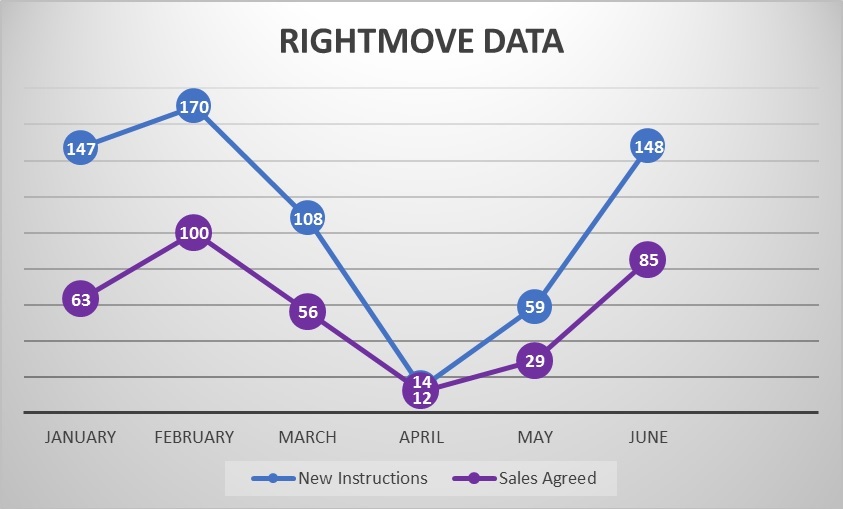
The local property market was showing very positive signs at the beginning of the year throughout January and into February, with the number of New Listings and Sales Agreed at healthy levels as you would expect to see. Then things began to turn in March as COVID-19 became the focus of everyone’s attention, and finally in April the market stopped almost entirely as viewings and mortgage applications were no longer possible.
In May, we can see the tide beginning to turn with urgent moves progressing and then in June we can finally begin to see what the property market looks like post lockdown… and so far it looks very good!
New property listings are quickly returning to pre-covid levels and as these properties attract the wave of new buyers from Central and South West London, we expect the number of sales agreed to catch up in July.
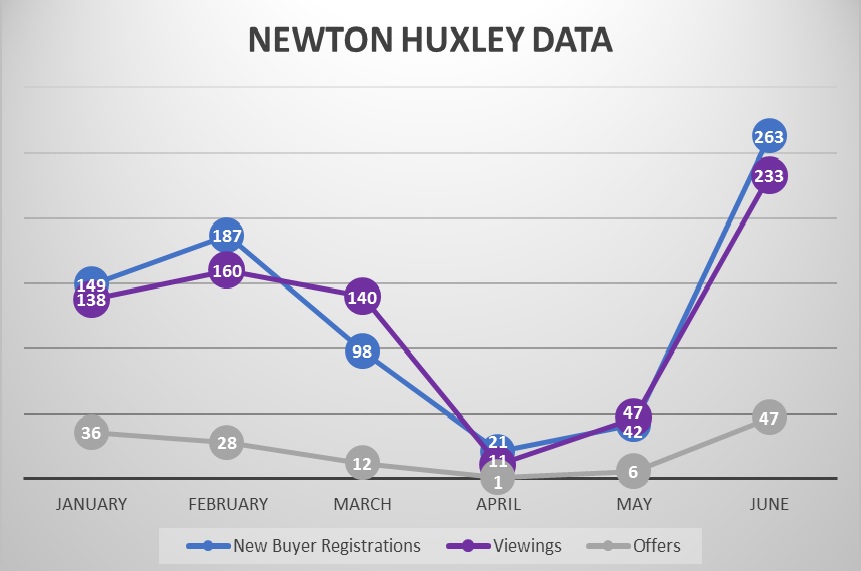
Our own internal data also shows positive signs for the local property market, with the number of offers received in June being at its highest level since October 2017.
This next graph shows the number of new buyers registering (people calling to ask us to help with their search for a property,) viewings booked, and the number of individual offers received on our listed properties.
Whilst it is too early to know for sure what the long-term impacts of COVID-19 will be on the property market, property transactions in the South East have been stunted since Stamp Duty Land Tax was changed in 2016 (by as much as 30% in our local area), and a bottleneck of buyers waiting for the right time to make their move has been building ever since.
Now interest rates are lower than ever before, and we’ve experienced a genuine public health issue that has had an impact on every single person one way or another. For many this has put things into perspective, and has served as a catalyst to further increase buyer migration out of Central and South West London, with some 51% of buyers that already live in the capital looking to move out.
With so many properties coming to market right now, and with lenders tightening criteria for mortgages, it is unlikely your property value will be shooting up any time soon. Many market reports are suggesting a 0% change in property values this year, and a modest 2% next year. So, if you have been waiting for the right time to move over the last few years like so many others in the KT7, KT8 and KT10 postcode areas, now is the closest you are going to get to the perfect time to finally get moving!
CLICK HERE To book a free valuation and market appraisal with one of the partner directors at Newton Huxley
If I had £1 for everytime someone asked me "what is the property market like at the moment?" I could pay off the mortgage for every friend and family member in the contact list on my phone!
The nature of the private housing market in Britain means that it is always changing and evolving, and the value of your property can change from month to month, and so called uncertainty surrounding UK politics has left many people unsure as to how this has affected the value of their home.
With the Pound (£) offering very good value for money against the Euro and US dollar, foreign purchases in Central London are reportedly on the up again, and as Molesey was more or less built for commuters, this has a knock on affect within our local market as many buyers who move to Molesey, do so after selling a property in London in search of more square footage, garden space and good schools whilst retaining the ability to get to work in London with relative ease.
So what does the property market look like now compared to this time last year? 2018 was our busiest year yet at Newton Huxley, and here is why we are confident that 2019 will be the same, if not better.
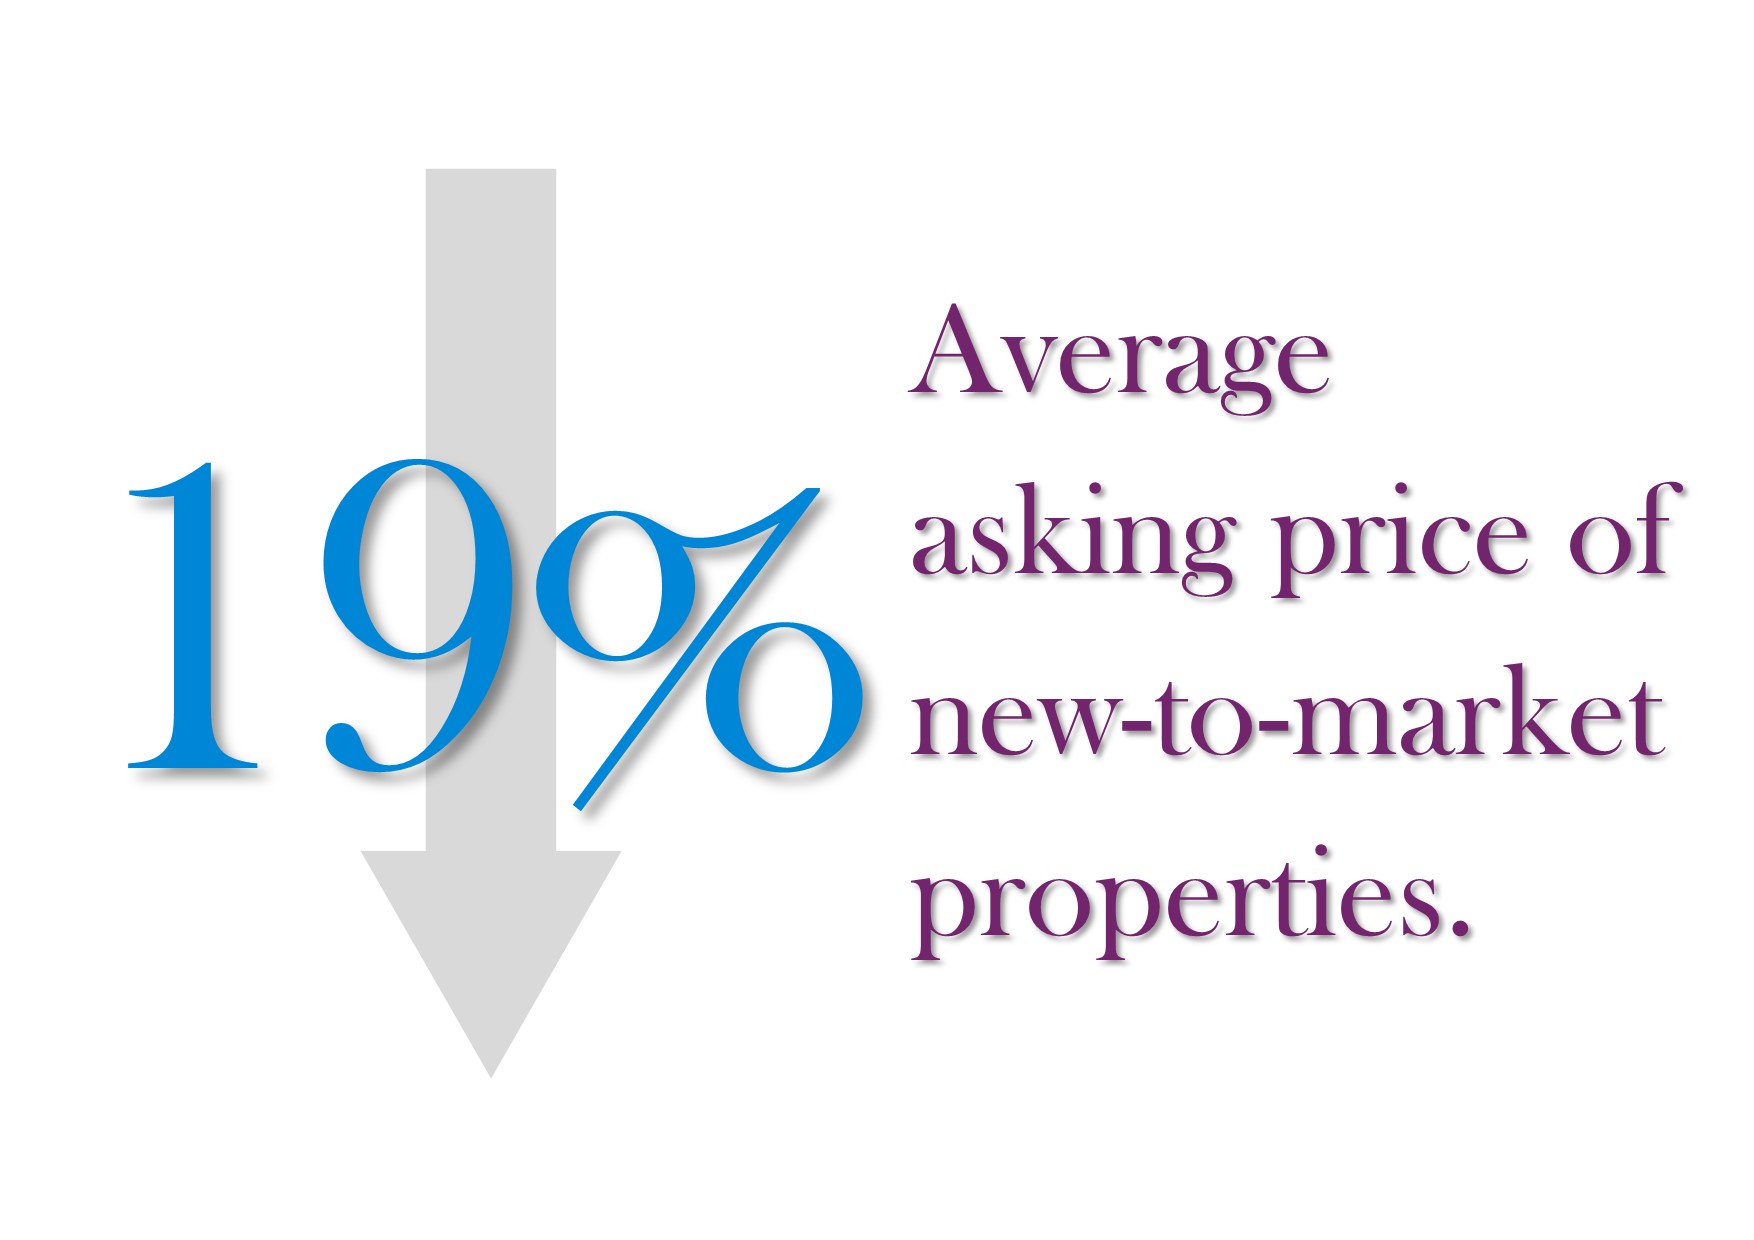
Now this does not mean that asking prices are down by nearly 20%! We have noticed more properties coming to market below the £500k threshold which shows more confidence from those looking to upsize from their first purchase. We also published an article last year explaining that over inflated asking prices were causing a slow down in the market (as commented on by The Times in their recent article about overvaluing) and that the eventual sale prices of properties had remained more or less the same, this shows that home sellers are adjusting their asking prices to be more in line with buyer expectations which will increase movement.
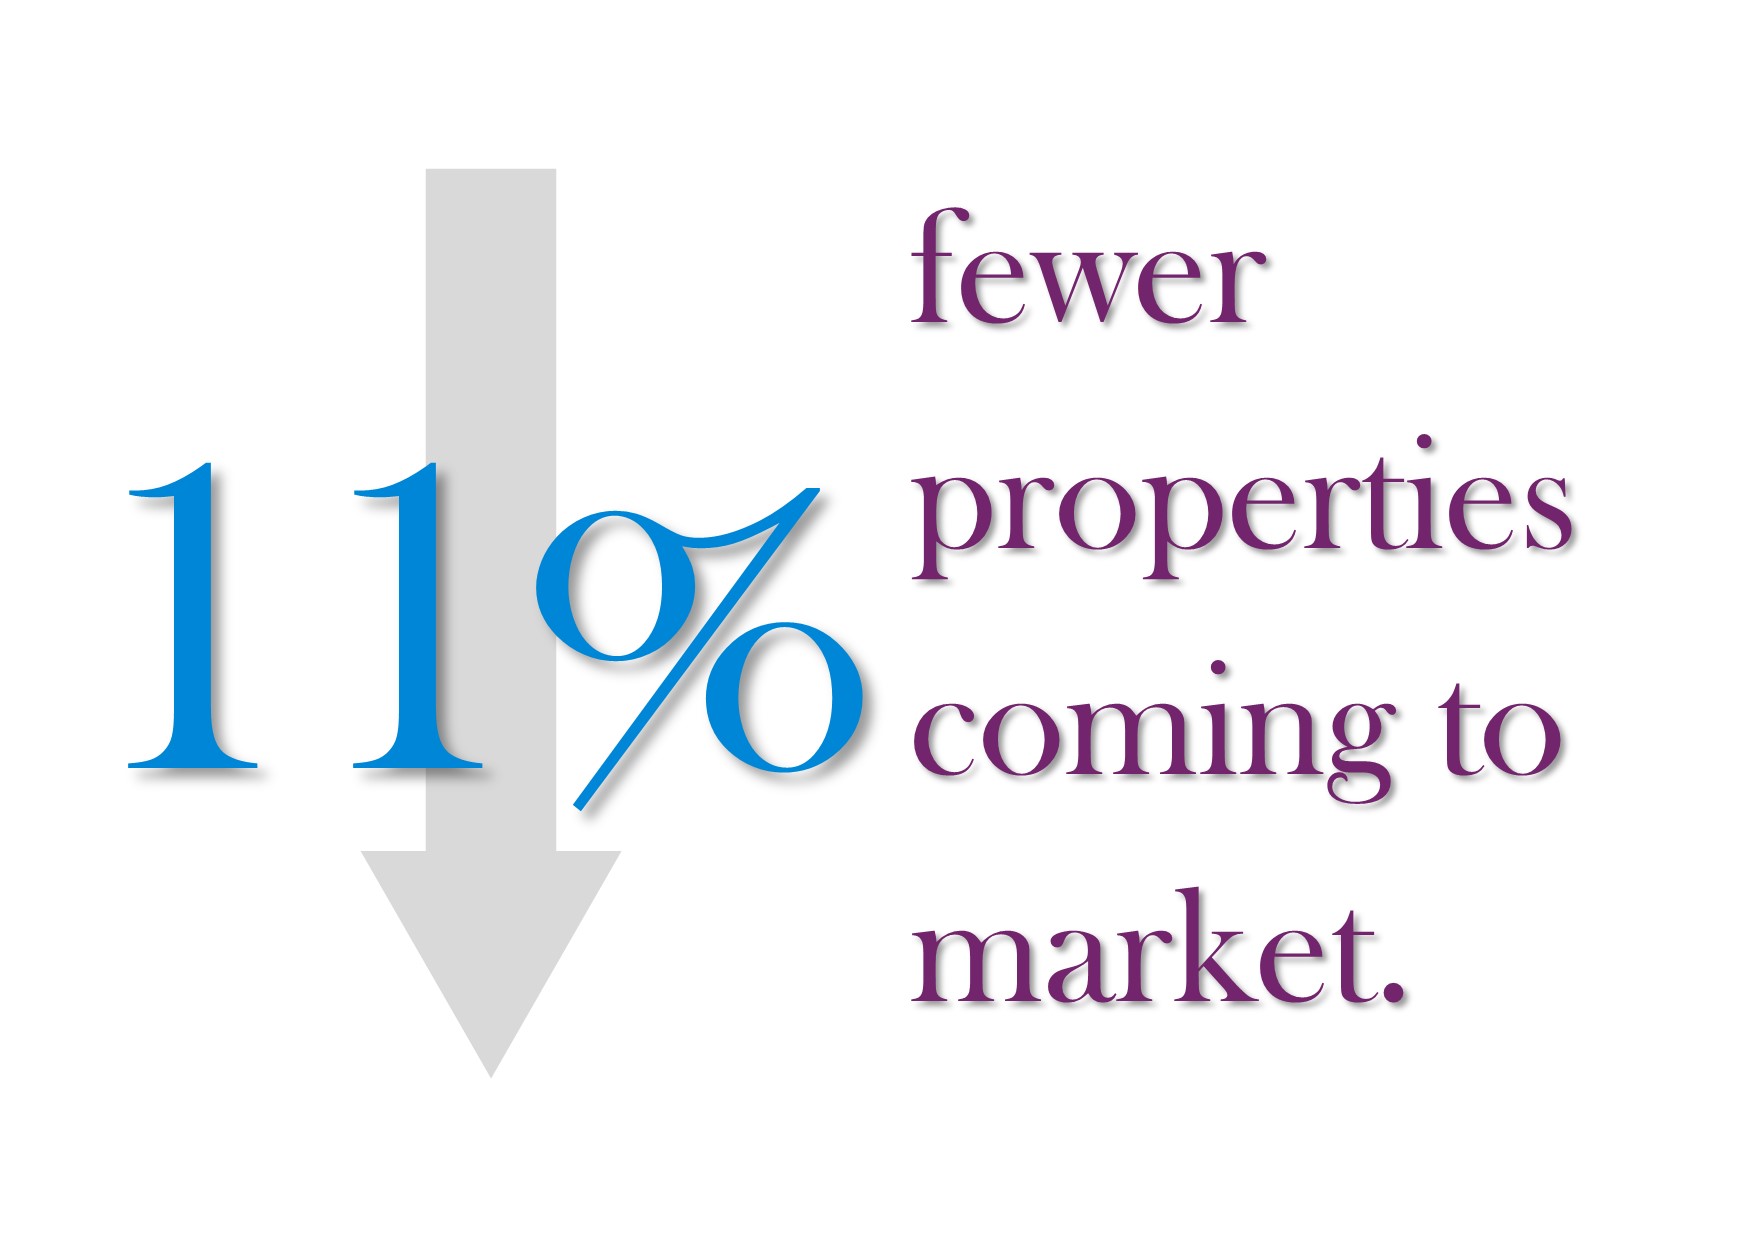
The number of new properties coming to market has been in decline for the past 2-3 years. In terms of real numbers, the difference is 73 new properties in 2018 vs 65 in 2019 and although this will help speed up a potential buyers decision making with slightly less choice to consider, we do not see this having any significant affect on pricing at this level.
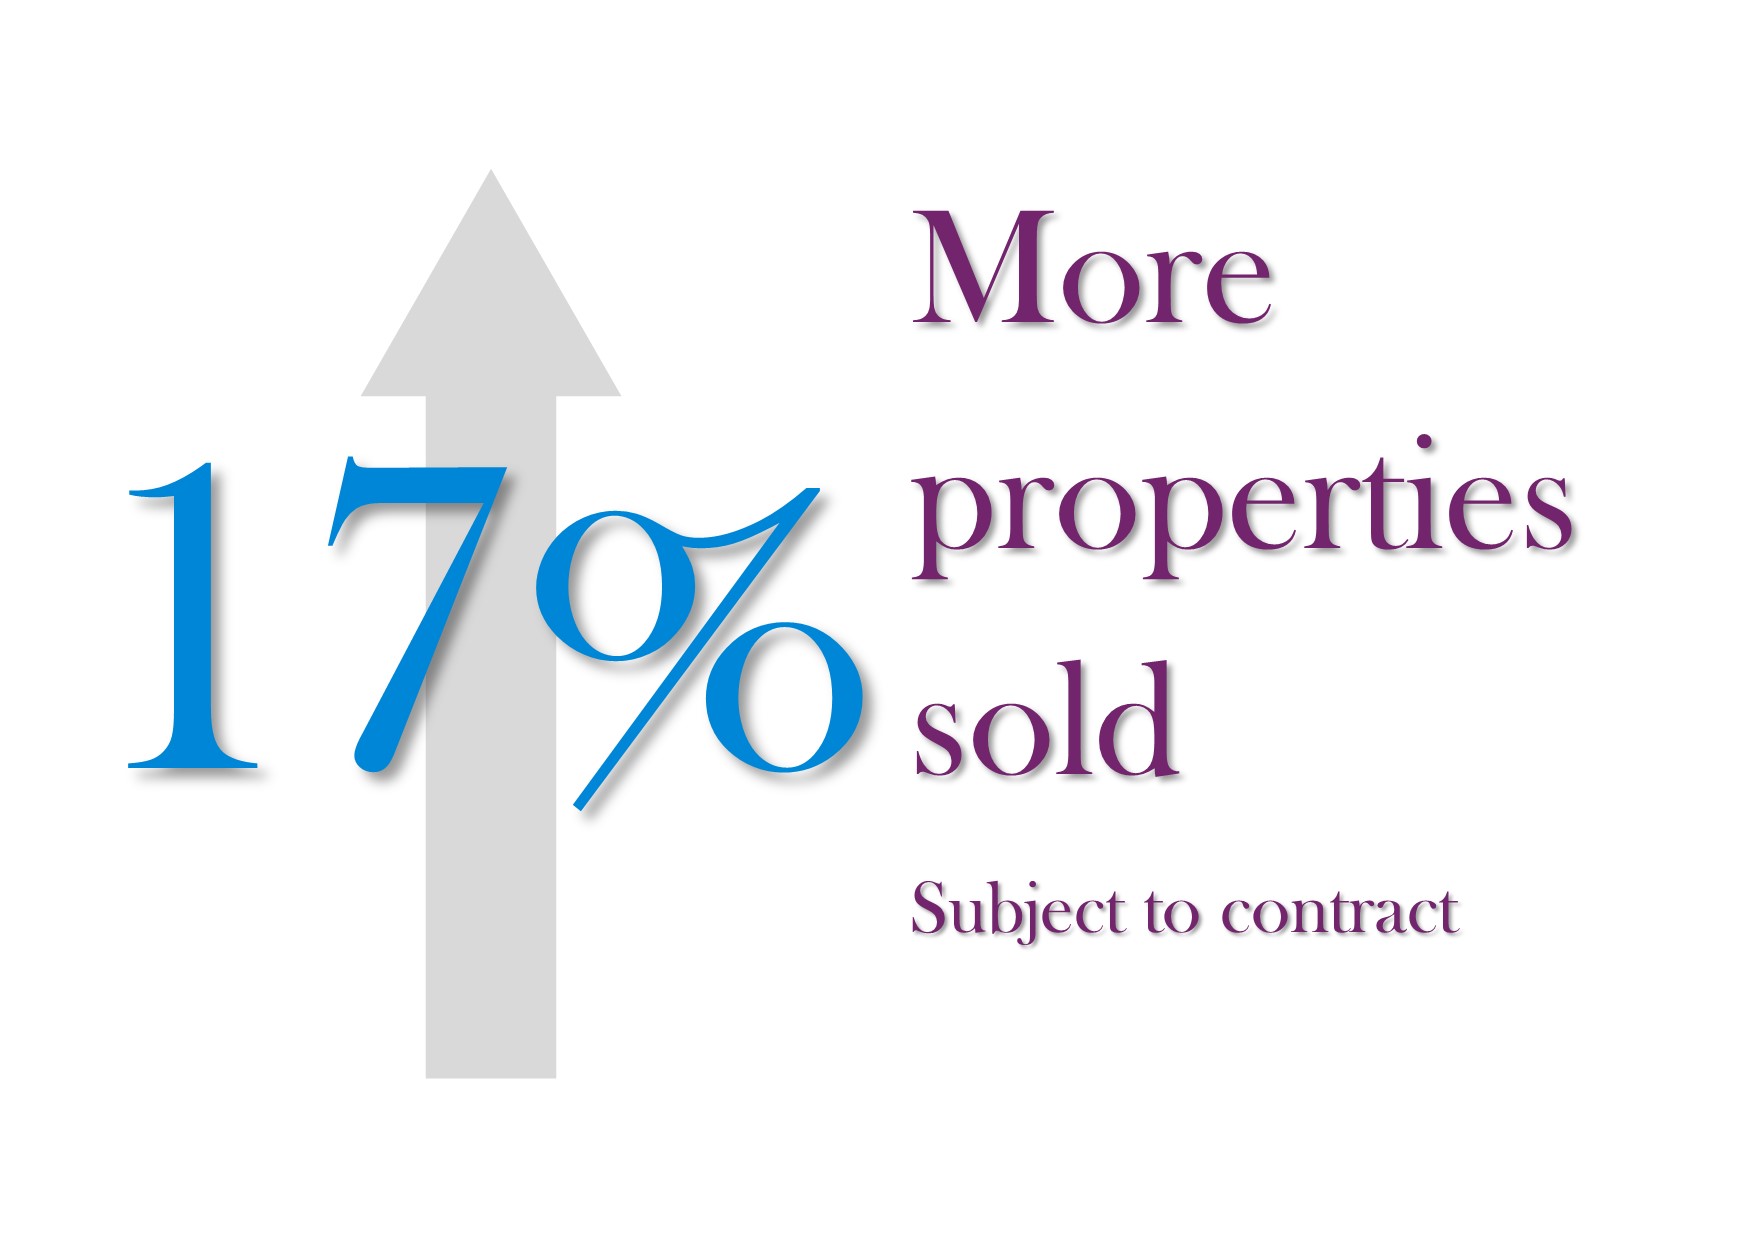
This is ultimately a result of the above two market factors, with less choice and more affordable properties on offer, activity will naturally increase. We have also noticed increased interest in properties that have previously been struggling to achieve a sale, showing further increased movement within Central and SW London is having a positive impact.
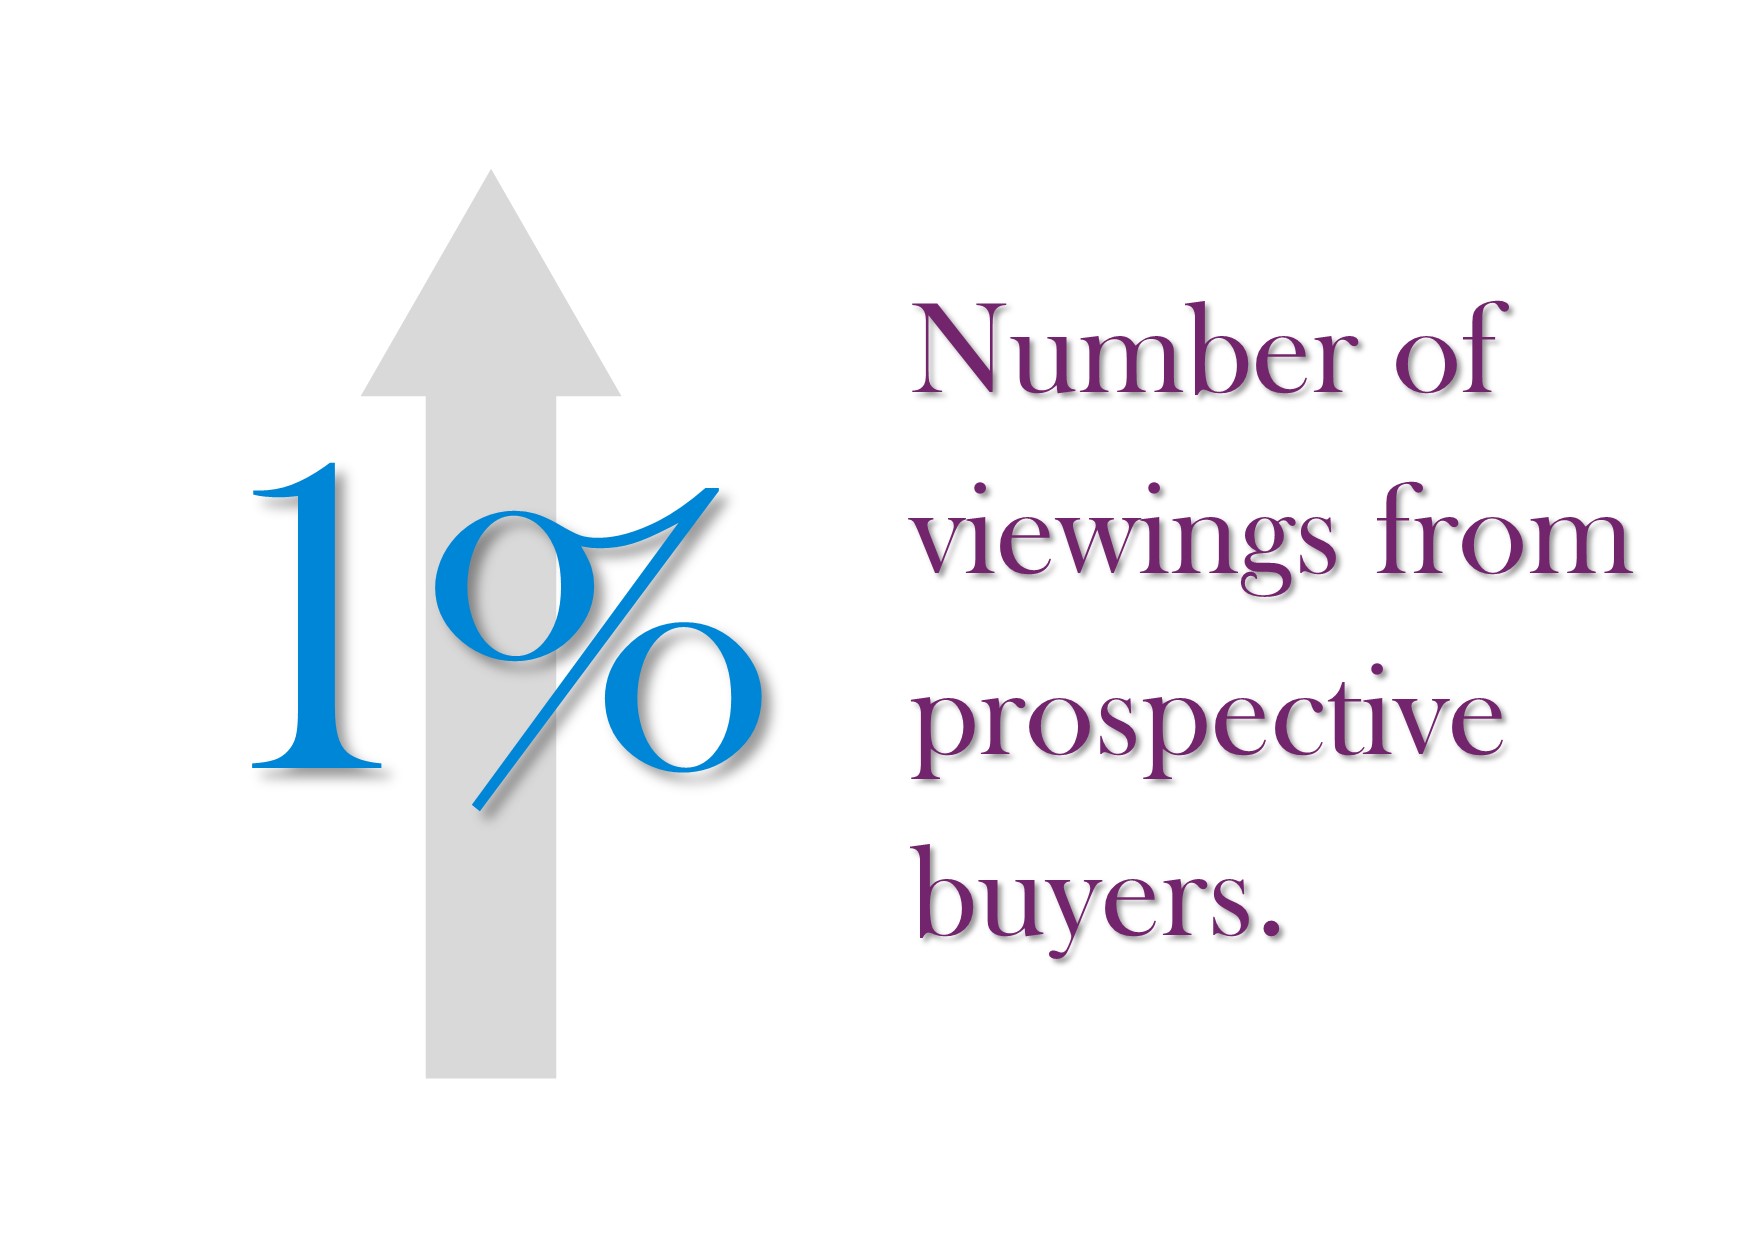
For practical purposes there is no real change here, this does however mean that a higher percentage of buyers that are out viewing, are making offers. It is more important than ever to ensure that the number of feet through the door from potential buyers remains high as this will dramatically increase your chances of securing a buyer and will help create a sense of urgency that will help you achieve the best possible price. In essence you should price your property to entice viewings and leverage negotiation against other interest as opposed to just stating what you want for your property as a seller, as this carries a lot more weight!
If you are thinking of selling and would like an idea on the current value of your home, you can use our FREE instant valuation tool below for an instant estimation. Additionally, if you have been on the market without success and would like to discuss other available strategies for selling your property, please call our Molesey team on 0208 396 6717 or email molesey@newtonhuxley.co.uk
GET AN INSTANT PROPERTY VALUATION FOR FREE!

Once again we have been trawling the land registry to gain further insight into the Molesey housing market. For many it has been a year of uncertainty and we are delighted to deliver some clarity to value and transaction trends in the Molesey area.
Hopefully you find the below statistics interesting, but if you would like to obtain an instant valuation of your own property, you can do so by clicking here:
FIND THE VALUE OF YOUR PROPERTY IN 60 SECONDS
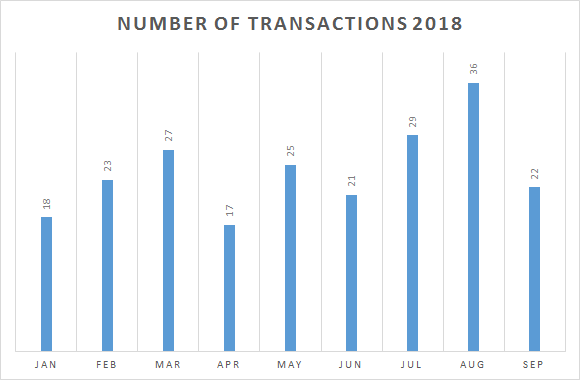
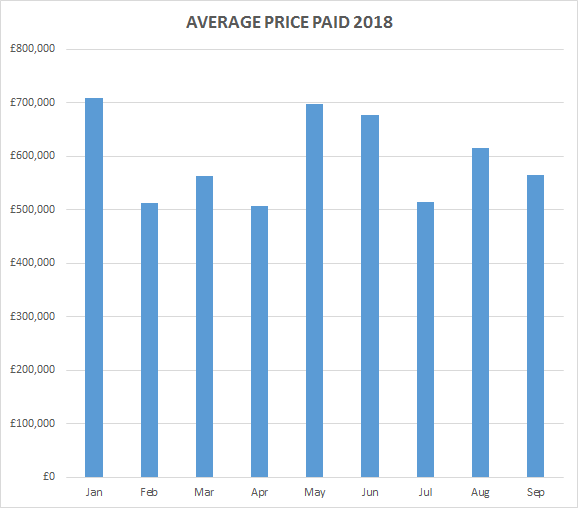
At the time of publishing this article the last full month of completed transactions submitted by the land registry was September 2018.
There were 658 new listings uploaded to Rightmove.co.uk between the 1st January – 3rd December 2018
Out of those 658 listings in Molesey (KT8 postcode), 49% reduced their asking price, and 43% of the total listings agreed a sale.
The number of completed transactions on record has remained in line with predictions at the begining of the year:
The average price paid has remained strong due to a lack of supply to the Molesey market, and a continued influx of buyers moving out of central and SW London.
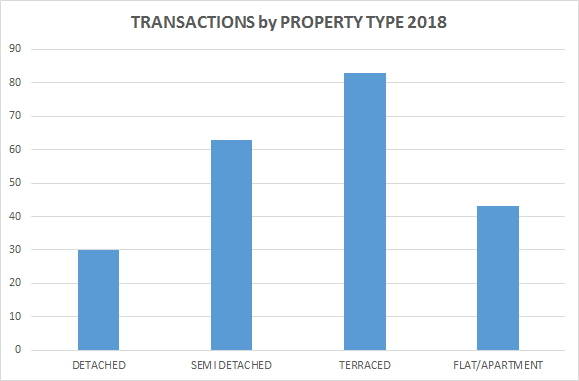
Terraced properties have the highest transaction rate in terms of property type, which is consistent with expectations given the number of terraced homes in Molesey.
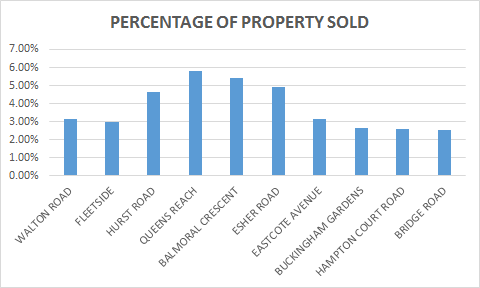
We have also calculated the transaction rate for the top 10 roads in Molesey. This is calculated as a percentage of the total properties on the road, as opposed to the total number.
Transaction levels remain surpressed, but values remain high.
If you are looking for more space and would like to upsize and sell your current property. Now is the perfect time to do so.
FIND THE VALUE OF YOUR PROPERTY IN 60 SECONDS

If you're a homeowner in Molesey, you'll be interested in the current value of your home. If you're looking to up or down size, and plan to stay local, you'll be interested in the current value of property on some of your favourite streets!
The list below shows the increase in value over the last 5 years, as well as the number of transactions over the last 12 months to give you an idea of how often property becomes available to buy in any given road.
If you would like an instant valuation of your own home, this handy instant valuation tool is completely free and will give you an immediate indication as to your properties current value

Road Name |
Price Change 5 years (+) |
Current Average Value £ |
Number of sales last 12 months |
| Rivermead | 555,316.00 | 1,125,994.00 | 1 |
| Harrow Gardens | 440,740.00 | 1,943,811.00 | 0 |
| Spencer Road | 436,911.00 | 1,926,926.00 | 1 |
| Arnison Road | 405,761.00 | 1,789,542.00 | 0 |
| Wolsey Road | 384,894.00 | 1,697,498.00 | 2 |
| Church Road | 375,389.00 | 1,655,595.00 | 0 |
| Palace Road | 351,571.00 | 1,550,545.00 | 4 |
| Hansler Grove | 347,510.00 | 1,532,631.00 | 1 |
| Vine Road | 332,602.00 | 1,466,880.00 | 0 |
| The Wilderness | 323,089.00 | 1,424,912.00 | 0 |
| The Riverside | 322,168.00 | 1,420,846.00 | 1 |
| St Johns Road | 312,721.00 | 1,379,196.00 | 0 |
| Kent Road | 308,844.00 | 1,362,082.00 | 2 |
| Beauchamp Road, KT8 0PA | 296,920.00 | 1,309,496.00 | 0 |
| Matham Road | 293,915.00 | 1,296,232.00 | 1 |
| Seymour Road | 276,458.00 | 1,219,254.00 | 1 |
| Hampton Court Crescent | 251,841.00 | 1,110,679.00 | 0 |
| Manor Road | 248,149.00 | 1,094,385.00 | 2 |
| Hurst Road | 244,939.00 | 1,080,230.00 | 8 |
| Hampton Court Road | 243,871.00 | 1,075,515.00 | 6 |
| Ember Lane | 239,680.00 | 1,057,032.00 | 0 |
| Molember Road | 234,291.00 | 1,033,254.00 | 0 |
| Grove Road | 224,022.00 | 987,973.00 | 0 |
| Ember Farm Avenue | 221,899.00 | 978,610.00 | 0 |
| Broadfields | 219,460.00 | 967,833.00 | 1 |
| Clinton Avenue | 217,167.00 | 957,727.00 | 1 |
| Ember Farm Way | 206,667.00 | 911,403.00 | 1 |
| Southfields | 205,744.00 | 907,347.00 | 1 |
| Parsons Mead | 202,956.00 | 895,043.00 | 1 |
| Hidden Close | 201,747.00 | 889,710.00 | 0 |
| Park Road | 201,725.00 | 889,626.00 | 3 |
| St Marys Road | 197,236.00 | 869,825.00 | 1 |
| Field Close | 196,826.00 | 868,015.00 | 1 |
| Molesey Park Close | 195,095.00 | 860,385.00 | 0 |
| River Bank | 194,206.00 | 856,467.00 | 1 |
| Feltham Avenue | 193,227.00 | 852,146.00 | 4 |
| Molesey Park Road | 193,077.00 | 851,498.00 | 1 |
| Riverside Avenue | 193,075.00 | 851,475.00 | 0 |
| Summer Avenue | 192,479.00 | 848,848.00 | 0 |
| Gladstone Place | 191,339.00 | 843,799.00 | 0 |
| Summer Gardens | 190,978.00 | 842,218.00 | 0 |
| Cedar Close | 179,814.00 | 792,979.00 | 0 |
| Esher Road | 178,588.00 | 787,583.00 | 5 |
| Cedar Road | 178,295.00 | 786,278.00 | 0 |
| Orchard Lane | 176,235.00 | 777,199.00 | 0 |
| Bridge Gardens | 171,336.00 | 755,588.00 | 0 |
| Summer Road | 167,554.00 | 738,909.00 | 3 |
| Cherry Orchard Gardens | 164,513.00 | 725,496.00 | 2 |
| Knights Close | 162,046.00 | 714,615.00 | 0 |
| Mole Abbey Gardens | 158,695.00 | 699,826.00 | 1 |
| Hampton Court Avenue | 154,042.00 | 679,314.00 | 1 |
| Nightingale Road | 150,204.00 | 662,380.00 | 0 |
| Hollingworth Close | 148,171.00 | 653,415.00 | 1 |
| Langton Road | 147,817.00 | 651,866.00 | 2 |
| Seymour Close | 146,355.00 | 645,407.00 | 0 |
| Pemberton Road | 144,745.00 | 638,309.00 | 1 |
| Hampton Court Way | 143,375.00 | 632,270.00 | 0 |
| Queens Reach | 143,311.00 | 631,977.00 | 1 |
| Augusta Close | 142,369.00 | 627,823.00 | 0 |
| Ash Island | 141,855.00 | 625,559.00 | 0 |
| Avern Gardens | 141,855.00 | 625,559.00 | 0 |
| Carleton Avenue | 141,855.00 | 625,559.00 | 0 |
| Graburn Way | 141,855.00 | 625,559.00 | 0 |
| Island Farm Avenue | 141,855.00 | 625,559.00 | 0 |
| Orchard Farm Avenue | 141,855.00 | 625,559.00 | 0 |
| Dunstall Way | 141,583.00 | 624,357.00 | 1 |
| Oarsman Place | 140,120.00 | 617,899.00 | 0 |
| Weston Avenue | 138,519.00 | 610,844.00 | 0 |
| New Road | 138,390.00 | 610,285.00 | 1 |
| Winchilsea Crescent | 138,087.00 | 608,341.00 | 0 |
| Cherry Orchard Road | 137,649.00 | 607,009.00 | 1 |
| Alders Grove | 137,513.00 | 606,401.00 | 0 |
| Sandringham Gardens | 137,168.00 | 604,881.00 | 0 |
| Garrick Gardens | 135,967.00 | 599,595.00 | 0 |
| Dennis Road | 135,279.00 | 596,552.00 | 2 |
| Mole Place | 135,064.00 | 595,609.00 | 0 |
| Churchfields | 134,392.00 | 592,626.00 | 1 |
| Park Way | 129,954.00 | 573,056.00 | 0 |
| Windsor Avenue | 127,266.00 | 561,208.00 | 1 |
| Hurst Lane | 127,136.00 | 560,639.00 | 3 |
| The Crescent | 125,726.00 | 554,414.00 | 0 |
| Balmoral Crescent | 125,675.00 | 554,200.00 | 3 |
| Molesey Park Avenue | 122,726.00 | 541,171.00 | 0 |
| Cannon Way | 120,481.00 | 531,284.00 | 1 |
| Creek Road | 120,366.00 | 530,770.00 | 0 |
| Freeman Drive | 119,689.00 | 527,800.00 | 0 |
| Adecroft Way | 119,168.00 | 525,506.00 | 0 |
| Minster Gardens | 118,278.00 | 521,577.00 | 0 |
| Helen Close | 116,014.00 | 511,576.00 | 0 |
| Challoners Close | 115,894.00 | 511,038.00 | 0 |
| Molesey Road | 115,479.00 | 509,214.00 | 3 |
| Monaveen Gardens | 115,071.00 | 507,412.00 | 1 |
| Avern Road | 113,954.00 | 502,497.00 | 1 |
| Merton Way | 113,761.00 | 501,650.00 | 3 |
| Green Lane | 113,379.00 | 499,971.00 | 1 |
| Creek Cottages | 113,071.00 | 498,598.00 | 0 |
| School Road | 110,879.00 | 488,954.00 | 2 |
| Bridge Road | 110,426.00 | 486,936.00 | 11 |
| Third Close | 110,020.00 | 485,133.00 | 0 |
| Redland Gardens | 109,303.00 | 481,970.00 | 0 |
| Buckingham Gardens | 108,520.00 | 478,514.00 | 4 |
| Bell Road | 108,115.00 | 476,739.00 | 3 |
| Lytcott Drive | 107,819.00 | 475,438.00 | 2 |
| Faraday Road | 107,807.00 | 475,389.00 | 2 |
| Ivydene | 107,573.00 | 474,466.00 | 1 |
| Rosemary Avenue | 107,568.00 | 474,345.00 | 1 |
| Thames Meadow | 107,447.00 | 473,796.00 | 0 |
| Beauchamp Road | 106,722.00 | 470,596.00 | 2 |
| St Peters Road | 105,208.00 | 463,915.00 | 0 |
| Cherimoya Gardens | 105,095.00 | 463,426.00 | 1 |
| Buckingham Avenue | 105,073.00 | 463,325.00 | 3 |
| Monks Avenue | 104,991.00 | 462,658.00 | 4 |
| Pool Road | 104,846.00 | 462,318.00 | 0 |
| Anne Way | 103,561.00 | 456,644.00 | 1 |
| Fleet Close | 102,943.00 | 453,935.00 | 0 |
| Kings Chase | 102,940.00 | 453,910.00 | 4 |
| Spring Gardens | 102,823.00 | 453,403.00 | 3 |
| Hotham Close | 102,468.00 | 451,836.00 | 0 |
| Bedster Gardens | 101,008.00 | 445,401.00 | 3 |
| Grafton Way | 100,968.00 | 445,219.00 | 3 |
| Linkfield | 100,819.00 | 444,558.00 | 1 |
| Chalford Close | 100,771.00 | 444,343.00 | 2 |
| The Dene | 100,619.00 | 443,690.00 | 2 |
| Molesham Close | 98,773.00 | 435,537.00 | 0 |
| Beldham Gardens | 98,244.00 | 433,208.00 | 0 |
| Dunvegan Close | 97,571.00 | 430,240.00 | 0 |
| Priory Lane | 97,521.00 | 430,027.00 | 2 |
| Boleyn Drive | 96,999.00 | 427,722.00 | 0 |
| Apps Meadow Close | 96,730.00 | 426,517.00 | 0 |
| Molesham Way | 96,386.00 | 425,021.00 | 2 |
| Tufton Gardens | 95,936.00 | 423,023.00 | 2 |
| Victoria Close | 95,245.00 | 419,989.00 | 0 |
| Faraday Place | 93,719.00 | 413,246.00 | 0 |
| The Forum | 93,279.00 | 411,312.00 | 0 |
| Dundas Gardens | 92,048.00 | 405,868.00 | 1 |
| Second Close | 91,938.00 | 405,401.00 | 0 |
| Bishop Fox Way | 91,748.00 | 404,543.00 | 0 |
| Berkeley Drive | 91,594.00 | 403,974.00 | 1 |
| Sadlers Ride | 91,543.00 | 403,645.00 | 1 |
| Kelvinbrook | 91,206.00 | 402,165.00 | 5 |
| Tonbridge Road | 90,549.00 | 399,259.00 | 0 |
| St Barnabas Gardens | 89,401.00 | 394,202.00 | 1 |
| Chandlers Close | 88,407.00 | 389,815.00 | 0 |
| Central Avenue | 88,089.00 | 388,421.00 | 1 |
| Brockenhurst | 87,585.00 | 386,195.00 | 0 |
| Walton Road | 87,399.00 | 385,372.00 | 3 |
| Island Farm Road | 87,320.00 | 385,020.00 | 0 |
| Fleetside | 85,496.00 | 376,987.00 | 9 |
| Spurfield | 84,838.00 | 374,071.00 | 1 |
| Spreighton Road | 84,823.00 | 374,016.00 | 1 |
| Rupert Court | 83,020.00 | 366,056.00 | 1 |
| Weldon Drive | 81,602.00 | 359,804.00 | 0 |
| Grange Road | 81,427.00 | 359,045.00 | 3 |
| High Street | 81,398.00 | 358,897.00 | 3 |
| Victoria Avenue | 80,377.00 | 354,404.00 | 2 |
| Odard Road | 79,706.00 | 351,453.00 | 0 |
| Belvedere Gardens | 78,494.00 | 346,072.00 | 2 |
| Approach Road | 76,115.00 | 335,598.00 | 0 |
| Ray Road | 75,613.00 | 333,385.00 | 0 |
| Dunstable Road | 74,748.00 | 329,568.00 | 0 |
| Upper Farm Road | 74,686.00 | 329,306.00 | 1 |
| First Close | 74,576.00 | 328,813.00 | 1 |
| Down Street | 74,458.00 | 328,293.00 | 2 |
| The Fairway | 74,320.00 | 327,692.00 | 0 |
| Carlyle Close | 73,739.00 | 325,122.00 | 2 |
| First Avenue | 73,396.00 | 323,615.00 | 3 |
| Glebelands | 73,067.00 | 322,158.00 | 1 |
| Mountwood | 72,527.00 | 319,793.00 | 3 |
| Wilton Gardens | 72,375.00 | 319,106.00 | 1 |
| Brende Gardens | 70,953.00 | 312,890.00 | 1 |
| Coppsfield | 70,422.00 | 310,481.00 | 0 |
| Grange Close | 70,185.00 | 309,442.00 | 1 |
| Manor Court, High Street | 69,378.00 | 305,883.00 | 0 |
| Cambridge Road | 68,752.00 | 303,124.00 | 0 |
| Molesey Avenue | 68,540.00 | 302,185.00 | 1 |
| Eastcote Avenue | 67,823.00 | 296,656.00 | 4 |
| Hampton Court Parade | 66,258.00 | 292,132.00 | 1 |
| Yeend Close | 63,297.00 | 279,064.00 | 0 |
| Palmers Grove | 62,798.00 | 276,798.00 | 0 |
| Grovelands | 59,903.00 | 264,088.00 | 3 |
| Pool Close | 58,023.00 | 255,799.00 | 2 |
| Central Parade | 57,883.00 | 255,180.00 | 0 |
As a whole, property values in Molesey have increased by £160,549.76 on average in the last 5 years, with the current average proeprty value in the area at £630,572.09.
If you are considering moving on to the next chapter of your life and would like to book a free market appraisal of your home, please click the link below, alternatively you can obtain a quick online valuation here.

You may be thinking of moving, or more likely, you are just interested to know if the value of your property has gone up or down. It can be really difficult to guage what is happening with property values, some estate agents are always talking up the market, and the media is generally extremely negative and apocalyptic about the housing market around Surrey and London.
Let us cut out the rhetoric and the "sales spiel" and get down to some undeniable cold hard facts!
Transaction Levels
For most of us, it feels like 2008 was only yesterday, the recession hit and transaction levels went through the floor. As an example, the KT10 postcode area (Esher, Claygate, Hinchley Wood) dropped from over 400 annual transactions to just 184. Since then transactions have increased until the most recent peak in 2013 of 446 total transactions. There has been a steady decline in the number of transactions since then, and in 2017 the Land Registry recorded 354 transactions across Esher, Claygate and Hinchley Wood. The level of transactions has declined by 21% since the most recent peak in 2013, but has increased by 4% over the last year. Hardly a disaster story and by contrast to 2008 levels, a very healthy market place indeed.
A similar story applies to areas like Molesey and Thames Ditton, with transaction levels down 21% over a similar period, and still way above 2008 levels.There really is no comparison to the 2008 recession that has been quoted by some of the more dramatic media sources. To sum up, we are not at the "height" of a market trend but we predict prices to remain where they are for the next 2-3 years with modest fluctuations of around 5% +/- throughout this period.
Property Values
So you know transaction levels are still high, just not as high as they’ve been before, and we know what we're all really interested in… The value of property!
Last year property values across Molesey, Esher, Claygate, Hinchley Wood and Thames Ditton slipped slightly, with the lower end of the market dipping around 5% and the £1m + market dipping by 7% or more. This was purely down to affordability issues and scepticism from would be buyers. As a company, we experienced a market where buyers wanted to buy with interest rates at an all-time low, but sellers were still hoping for record breaking prices creating a gap that either the seller, or the buyer needed to fill. As the consumer dictates the price of a product by demand, this quickly formed a "buyers’ market" mentality, but once asking prices were adjusted, there were plenty of buyers for every property as they jumped at the chance to secure a reasonably priced home.
Since the beginning of 2018, house values have increased across all of the areas we cover: KT10 by 5%, KT8 by 3.14% and KT7 by 5.43%, this shows that the adjustment in asking prices last year from the majority of sellers created more competition from buyers and therefore, persuaded buyers to part with (or borrow) more cash to purchase their next home.
What we are still seeing is an extremely price sensitive marketplace, overestimating your property's value or listing with an agent purely because they provided you with a surprisingly high and intoxicating valuation, can cost you in the long run. Where properties remain on the market for longer than expected, buyers will assume you are desperate to sell and we have in extreme cases, received offers 15% below asking price. This will hinder your chances of getting market value and will make it nearly impossible for your agent to negotiate the best possible price for your property. Correct asking price = hordes of buyers = multiple offers = best price AND best position to proceed.
If you are thinking of selling, look at the sold history in your area on either Rightmove, Zoopla or Land Registry, asking prices are not always, what a property will sell for. Check how long a property has been on the market for, ask yourself why it hasn't sold if it has been on the market for months. Get multiple valuations from agents who have a good record of accomplishment in your area, listen to the facts and evidence rather than just listening to what you hope to hear. In an age where "fake news" has penetrated the majority of information sources, only the facts and evidence that you can verify matter, and that is all a buyer will consider – unless they fall in love with your property and have to submit a sealed bid because there are multiple interested parties! They are more likely to consult their mortgage broker than sold data at that stage!
If you are thinking of selling, would like clear advice on the value of your home and the best marketing strategy to adopt when and if you decide to sell, please call our sales team on either 0208 396 6717 or 01372 631 622 for more information. Alternatively, you can book a FREE valuation by clicking the link below.
BOOK A VALUATION
Over the past few years, interest in Molesey as an area for families moving out of London has increased significantly. Mainly driven by price, areas such as Molesey also offer great schools and a more "family paced" lifestyle.
This is why we work incredibly hard to draw in the attention of these better budget buyers, many of whom have not considered Molesey as an area but are looking in surrounding towns such as Hampton, Thames Ditton, and Esher. Needless to say, they are soon converted to the idea of living in Molesey and as many you know, once you move into Molesey, you tend to stay forever!
So with all of the positives that and area such as East Molesey has to offer, and with recent events such as the change in stamp duty bandings, and the EU refurendum, London is going through a period of uncertainty, but people are still keen to buy. Combine this with a shortage of homes coming to market and you have a recipe for a quick sale at a great price.

Recent Rightmove data shows that more homeowners in East & West Molesey are choosing Newton Huxley Estate Agents to sell their home over any other Molesey Estate Agent.
It really is great to see how recommendations spread fast. The team has worked tirelessly to provide all of our customers with a friendly, straight forward and diligent service. In such a competitive market and at a time when stock levels are lower than usual (a.k.a "a sellers market") we see our commitment to providing the best service available in estate agency really working wonders.
A sellers’ market is something that many home owners will welcome (especially if you're not making an onward purchase), as this inherently pushes property values upwards. However, the dangers of over pricing can also increase as agents "starved" of new instructions seek to impress potential clients with over inflated valuations. Not only can this throw a real spanner in the works in terms of the time it takes to sell your property, but it can also encourage low offers if your property remains on the market for a prolonged period of time.
Here are three ways we think sellers in the Molesey area can avoid the aggravation of price inflation:
1. GET A ROUGH IDEA ON THE VALUE OF YOUR HOME.
Simply having 2 or 3 estate agents out to value your property may not be enough, it may seem obvious but looking at other properties that are currently on the market, or that have recently sold will give you a very good idea of what your property is worth. A simply way to judge another property by comparison to yours is to check photographs for condition and floor plans for size. If the property is not under offer, check the listing history to see how long the property has been on the market. The internet is overflowing with local property price information and we have access to archive data on literally 1000's of properties. (contact us for more information 0208 396 6717 | info@newtonhuxley.co.uk)
2. BROWSE THE WEBSITES OF POTENTIAL AGENTS.
We are surprised to learn that many of our clients ONLY call us because they have noticed "sold" boards or have received a letter from us, you can easily tell if an agent is proactive and a consistent performer by the presentation of their website, and the quality of their property photography. If you want to achieve the best possible price for your home you need to attract as many buyers as possible, presenting your home to the market with great photos on an easy to use website will make all the difference. After all, there is a reason that Waitrose can charge more for a bag of sugar than ASDA. It’s all in the presentation!
3. AVOID ON LINE INSTANT VALUATION TOOLS.
Some property and estate agent websites offer an instant valuation. The algorithms used in these apps are nowhere near detailed enough to provide a reliable valuation of your property. In some cases, we have seen these provide valuations that are off by over 25%! Until additional data can be stored within these applications such as square footage and internal condition we recommend you avoid the temptation to use them.
The first two weeks of marketing your property are crucial, and an unrealistic asking price can not only put potential buyers off, but will encourage "low ball" offers if your property remains on the market for too long.
Interpreting the market correctly and setting your asking price at just the right level will help you achieve the best result possible. We are proud to report that more than 70% of the properties we have sold are at record prices when compared with similar properties in the immediate area, whilst achieving more than 98% of asking prices throughout 2015, many of which were previously on the market without success. Further proving that our model for selling property is highly effective.
If you are considering selling in East or West Molesey and the surrounding areas, and would like an independent valuation of your home without obligation and free of charge. Please call our team on 0208 396 6717 or email info@newtonhuxley.co.uk

So why are buyers queuing up to see properties in East and West Molesey? Truthfuly, no-one really knows as there are many factors to consider; the general election, mortgage rates, budget cuts and so on.
Property markets have "boomed" after general elections in the past, and there have been a long list of additional factors that prevented this from happeneing earlier in the year. Our opinion is that buyers that would have made their purchase in the summer delayed their move, causing a bottleneck effect as they begin to start up their search in the East and West Molesey areas for the final quarter of the year.
Does this mean that the winter period will be unusually busy as well? Only time will tell. All we have to go by is that every season this year has acted out of character from what we are used to, our bet is on a strong market in Molesey right up until Christmas, but of course this is our totally bias opinion!
If you are planning a move, our property valuations and market appraisals are offered free of charge. Why not find out the value of your home so that you can make an informed decision on whether or not now is the right time to move!
T: 0208 396 6717
E: info@newtonhuxley.co.uk
Request a valuation, click the box below!

The current property drought is nationwide, with the average price of a property sold subject to contract in the UK in September at £221,797. On top of that, the supply of properties for sale is 14.3% down compared to 12 months prior, and 3.1% from August this year.
New instructions are also down 18.5% in London, where the average house price last month was £521,383.
Buyer activity is being magnified, with new buyer registrations up 8.4% annually, in particular the number of new first-time buyer registrations is up 7.4% with the current low mortgage rates.
What does this mean for the East and West Molesey property market?
Already we have seen a spike in new buyer registrations with many homes going under offer with the first seven days of marketing, and on average we are acheiving 98% of asking prices. A sure sign that there are more buyers per property.
The affect this has had on the Molesey property market is great news for those planning to sell in the near future. In the past 6 months property prices in East and West Molesey have increased by £15,583 on avg (2.86%), with 117 transactions in the KT8 postcode area in the same time period.
For the first 6 months of 2015 there were 164 transactions which shows a drop in completed sales of around 28%. It is no wonder then that as the amount of new buyers searching for a home increases, and new instructions coming to market dropping, property prices have increased significantly.
This bubble will burst when mortgage rates rise and there are numerous reports that suggest this will happen in the not too distant future, when this happens we anticipate buyer activity will decrease and property values will level off temporairily. We therefor urge anyone considering selling to take advantage of the current market and to bring any plans to sell forward where possible.
Should you require a valuation and market appraisal of your home our appointments are offered free of charge and without obligation. Please contact our sales team on 0208 396 6717 to arrange your appointment.

Sam Kamali | Sales Director
07957 301 214 | sam@newtonhuxley.co.uk

Is now the right time to sell?
Figures from August show UK mortgage borrowing increased by the largest amount since the economic crash and should be taken as another sign that the housing market is heating up.
According to the Financial Times mortgage lending rose £3.4bn. The amount of new mortgage approvals for house purchases have reached an 18-month high of 71,000, according to figures released last Tuesday by the Bank of England.
Approvals for mortgaging also rose in August from the previous month as home owners sought to lock in current low interest rates deals.
Expert analysts are constantly warning that a shortage of supply on the market has been driving up values, especially in the London and Greater London Area.
With this in mind, if you are thinking of selling now is the perfect time to come to market before the Christmas market hits and buyers slow down. If you are about to come to market or already selling and you are without a buyer, call us to find out more about these findings and how our results back this information.
Sam Kamali | Diretor of Residential Sales
0208 396 6717 (option 1) | sam@newtonhuxley.co.uk
Elevating the Elmbridge property market
Visit us in Molesey
East Molesey
Surrey
KT8 9ER
VISIT US IN ESHER
Claygate
Esher
Surrey
KT10 0PD