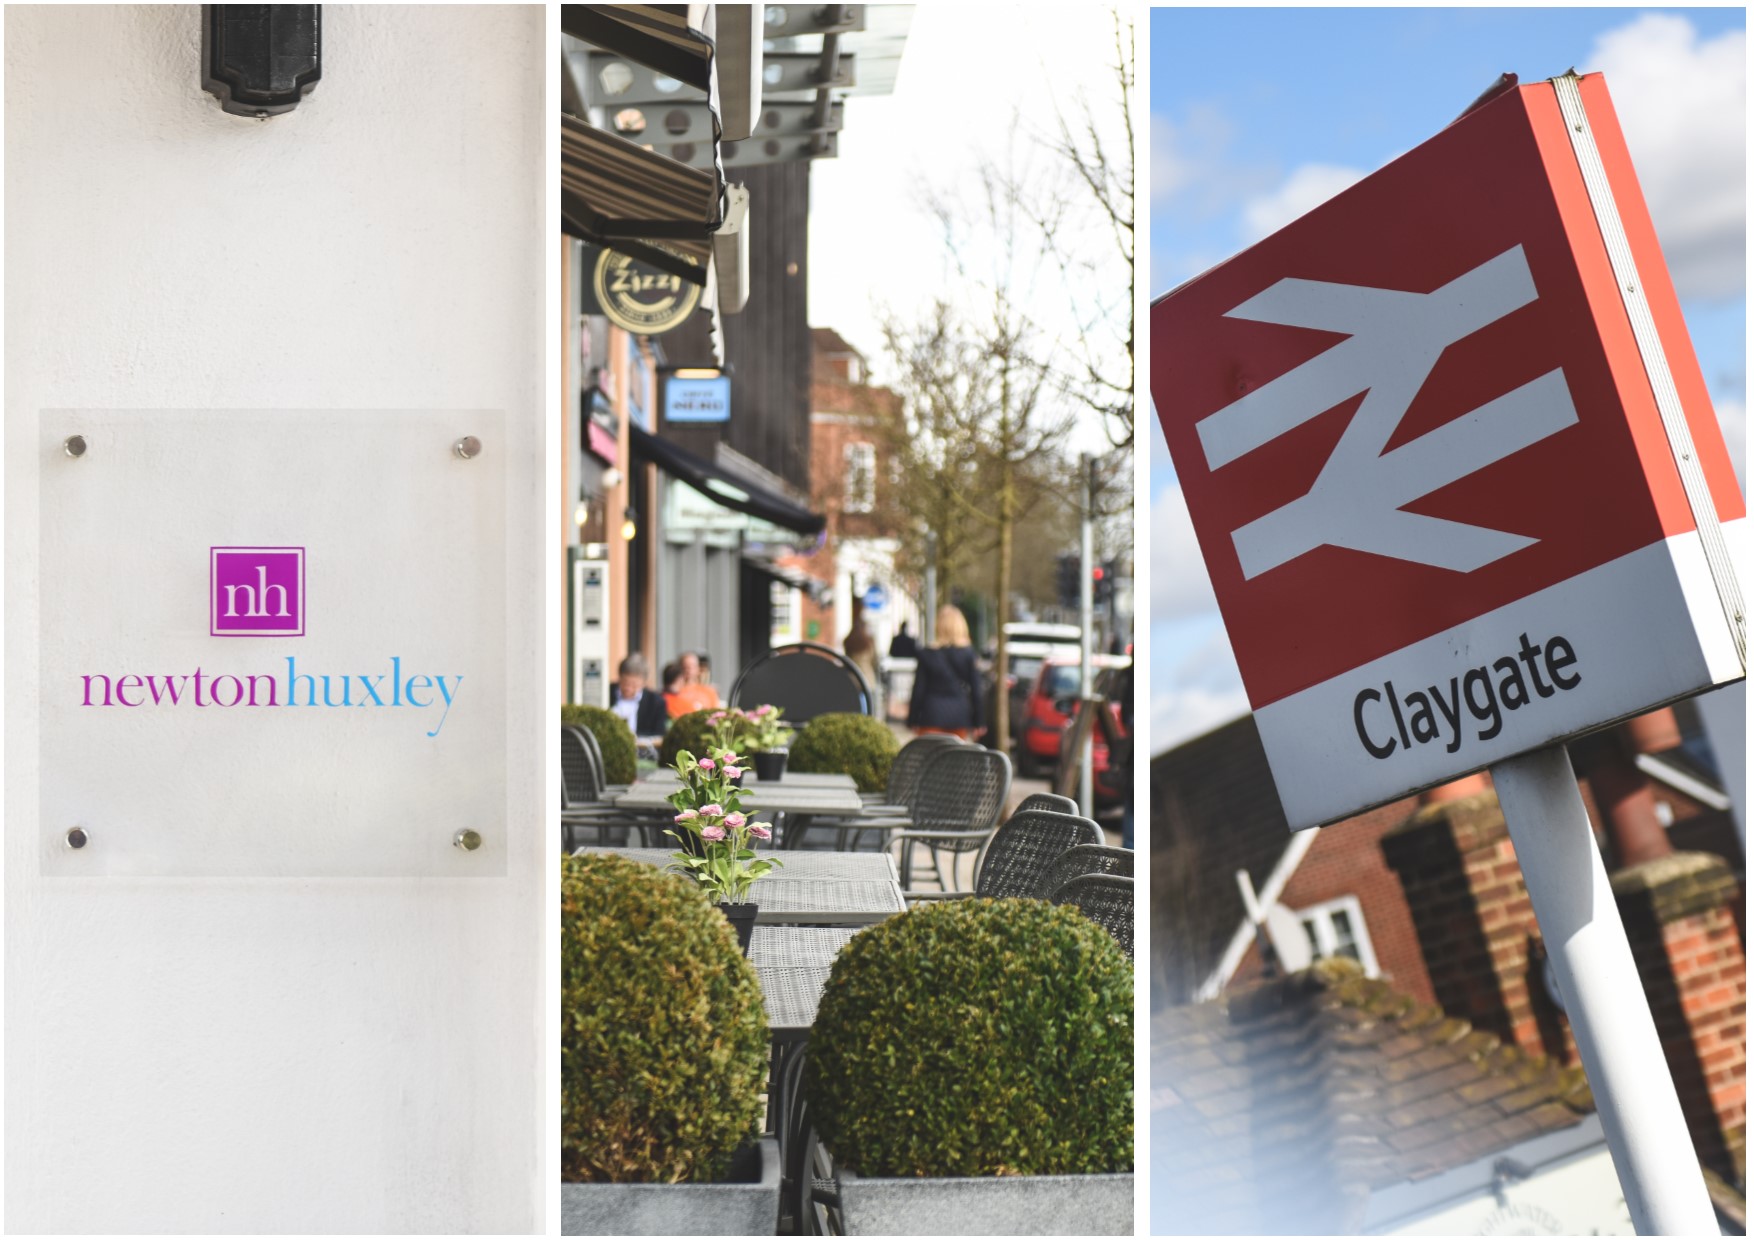
Watch our latest Claygate area guide.
Claygate is an amazing village with lots to offer. With its abundance of independent shops and restaurants, pubs and long walks, community events and commuter links, it’s no wonder that Claygate Village is a popular location for those moving out of the city.
Newton Huxley founder Len Taylor takes us on a tour of this vibrant village.

Tap to visit us on Instagram for local news, property tips and more!
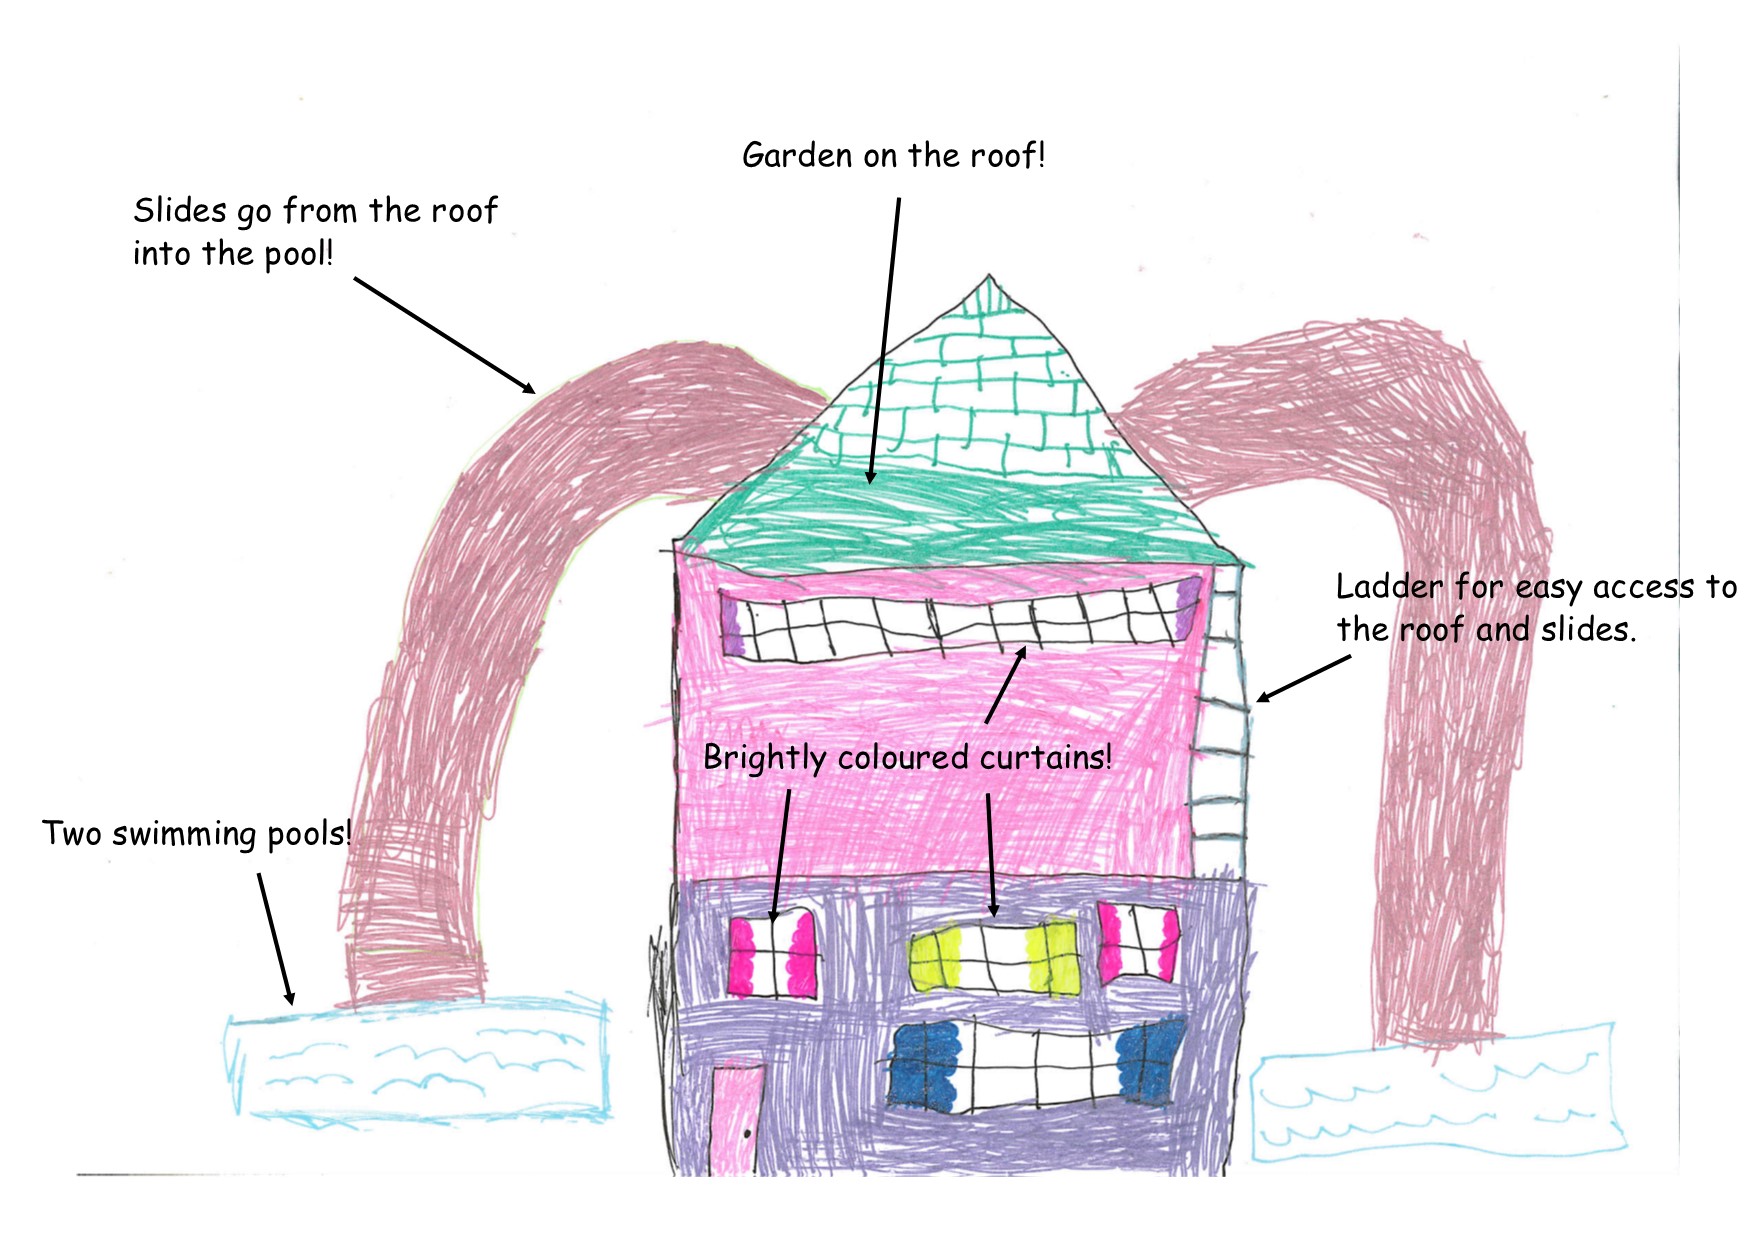
Example by Maddie age 6, from Claygate.
Want to be in with a chance of winning a brand new Nintendo Switch? All that you have to do is draw us a picture of your dream home. Now this could be a home in outer space, this could be a medieval castle, this could even be a Minecraft house!
Once you’ve drawn your picture get your parent or guardian to like or follow us on Facebook or Instagram, and they can either take a picture of your picture and email it in to us, or alternatively they can drop it into one of our branches in East Molesey or Claygate.
Entries will be displayed on our screens in branch and 5 finalists will be posted to social media, the finalist with the most likes will be announced as the winner and will receive a brand new nintendo switch console!
RULES FOR ENTERING THIS COMPETITION ARE AS FOLLOWS:
- This competition is for children aged 11 and under.
- Entry is only available to local residents of; Claygate, Esher, Thames Ditton, Hinchley Wood, East Molesey and West Molesey. (Your postcode must start with KT8, KT7 or KT10 and winners will be asked to provide proof of address from their parent or guardian)
- The parent or guardian must like or follow our Newton Huxley Facebook or Instagram pages for your entry to be counted.
- Only entries received by the 16th March 2021 will be entered
- All entries will be displayed on screens at out offices so please make sure you put your name and age so we can add it to your picture.
- Entries can be made by either emailing to len@newtonhuxley.co.uk or dropped directly to our offices at either 15 The Parade, Claygate, Surrey, KT10 0PD or 33 Bridge Road, East Molesey, Surrey, KT8 9ER – dropping directly will alow us to scan your picture and will look best!
- Finalists will be selected and their pictures will be uploaded to Facebook and Instagram, the picture that receives the most collective likes by the 31st March will be announced the winner and invited to collect their Brand New Nintendo Switch from our offices.
We would prefer that you drop entries into one of our offices so that we can scan and upload the image clearly, but you can also submit you entry by email to len@newtonhuxley.co.uk

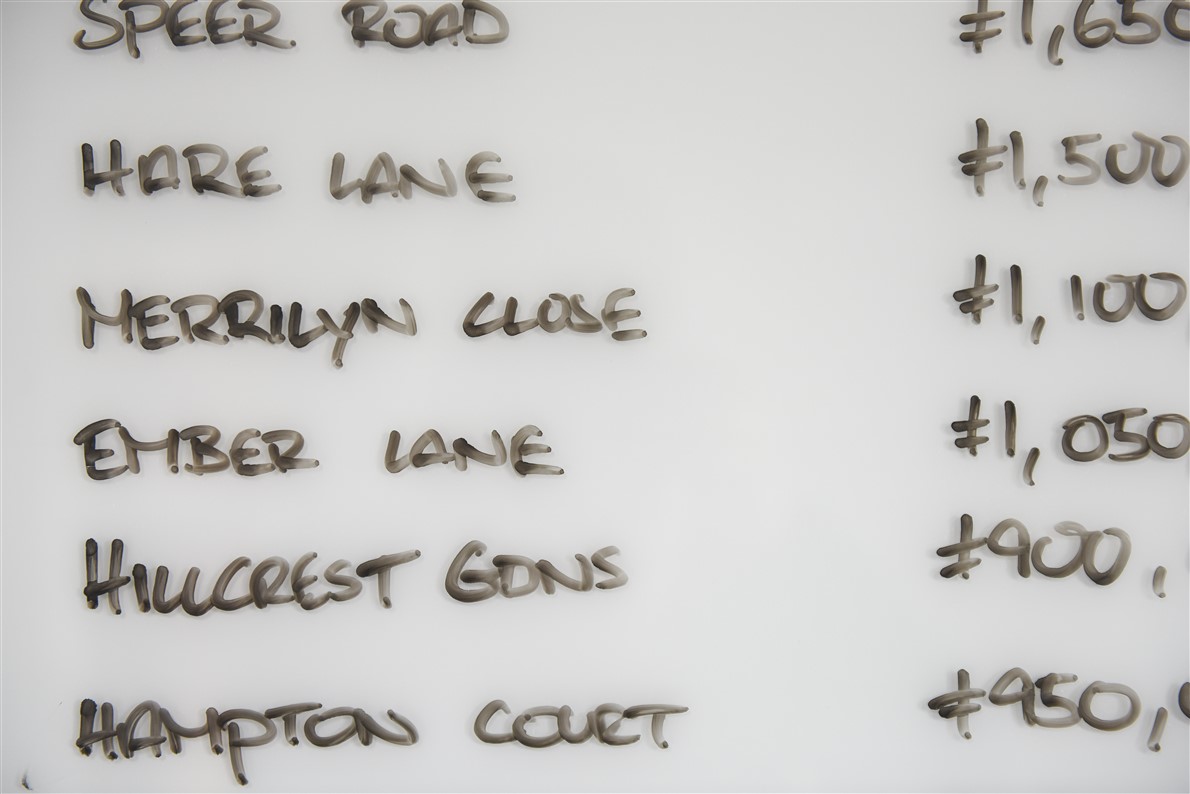
If you live in either Esher, Claygate or Hinchley Wood, you may be interested in average property values. If you are looking to buy in the area, you may be interested to know the average value of a property in your favoured roads. We have it covered with our comprehensive list of average property values, increase over the last 5 years, and the number of completed transactions over the last 12 months.
Given there are nearly 300 roads accross the KT10 postcode area, we have listed each road in alphabetical order, with a top 25 list for price increase, and a top 25 list for number of completed transactions.
GET AN ESTIMATED VALUE OF YOUR OWN PROPERTY IN 60 SECONDS.
Road Name |
Price Change 5 years (+) |
Current Average Value £ |
Number of transactions last 12 months |
| Acorns Way | 590,488.00 | 2,708,049.00 | 0 |
| Albany Close | 522,427.00 | 2,395,900.00 | 1 |
| Albany Crescent | 160,764.00 | 737,201.00 | 0 |
| Alma Road | 111,761.00 | 512,452.00 | 1 |
| Applegarth | 194,498.00 | 891,925.00 | 1 |
| Arbrook Chase | 524,196.00 | 2,404,007.00 | 0 |
| Arbrook Lane | 303,358.00 | 1,391,204.00 | 0 |
| Arran Way | 100,004.00 | 458,539.00 | 0 |
| Ashburnham Park | 532,347.00 | 2,389,218.00 | 0 |
| Ashton Place | 135,507.00 | 621,357.00 | 0 |
| Aston Road | 105,648.00 | 484,421.00 | 0 |
| Avondale Avenue | 189,220.00 | 867,697.00 | 4 |
| Beaconsfield Gardens | 387,365.00 | 1,776,462.00 | 0 |
| Belvedere Close | 80,813.00 | 370,531.00 | 0 |
| Berkeley Gardens | 282,944.00 | 1,297,568.00 | 0 |
| Blackhills | 911,204.00 | 4,178,955.00 | 1 |
| Blair Avenue | 98,327.00 | 450,840.00 | 1 |
| Blakeden Drive | 98,327.00 | 450,840.00 | 1 |
| Bracondale | 360,545.00 | 1,653,465.00 | 0 |
| Brendon Close | 270,073.00 | 1,238,528.00 | 1 |
| Brendon Drive | 290,118.00 | 1,330,454.00 | 0 |
| Bridle Road | 174,801.00 | 801,572.00 | 0 |
| Brisson Close | 203,965.00 | 935,330.00 | 0 |
| Brookfield Gardens | 102,794.00 | 471,338.00 | 0 |
| Broom Close | 516,905.00 | 2,373,208.00 | 1 |
| Burns Terrace | 230,708.00 | 1,057,992.00 | 0 |
| Caerleon Close | 260,637.00 | 1,195,252.00 | 0 |
| Carleton Close | 202,486.00 | 928,546.00 | 0 |
| Carrick Gate | 293,371.00 | 1,345,374.00 | 0 |
| Carrington Place, Esher Park Ave | 286,975.00 | 1,315,208.00 | 1 |
| Cavendish Drive | 186,290.00 | 854,265.00 | 1 |
| Cedar Close | 284,021.00 | 1,302,495.00 | 0 |
| Cedar Walk | 353,869.00 | 1,622,832.00 | 0 |
| Chadworth Way | 239,942.00 | 1,100,337.00 | 1 |
| Charlotte Court | 427,591.00 | 1,960,944.00 | 0 |
| Charlotte Mews | 88,100.00 | 403,932.00 | 0 |
| Chesterfield Drive | 219,573.00 | 1,006,927.00 | 0 |
| Chestnut Avenue | 226,319.00 | 1,037,857.00 | 3 |
| Church Road | 142,497.00 | 653,428.00 | 0 |
| Church Street | 107,713.00 | 493,909.00 | 0 |
| Clare Hill | 831,726.00 | 3,814,436.00 | 1 |
| Claremont Avenue | 263,740.00 | 1,209,474.00 | 0 |
| Claremont Drive | 637,611.00 | 2,924,477.00 | 1 |
| Claremont End | 520,354.00 | 2,386,372.00 | 0 |
| Claremont Lane | 350,740.00 | 1,608,489.00 | 0 |
| Claremont Park Road | 986,560.00 | 4,524,574.00 | 0 |
| Claremont Road | 333,072.00 | 1,527,452.00 | 0 |
| Claygate Lane | 215,813.00 | 989,667.00 | 1 |
| Claygate Lodge Close | 230,708.00 | 1,057,992.00 | 1 |
| Clive Road | 415,689.00 | 1,906,358.00 | 1 |
| Common Lane | 372,830.00 | 1,709,801.00 | 0 |
| Common Road | 139,868.00 | 641,370.00 | 3 |
| Compton Close | 230,708.00 | 1,057,992.00 | 0 |
| Copsem Lane | 202,892.00 | 930,407.00 | 3 |
| Copsem Way | 509,949.00 | 2,338,662.00 | 0 |
| Cornwall Avenue | 217,939.00 | 999,432.00 | 0 |
| Cotswold Close | 226,419.00 | 1,038,302.00 | 1 |
| Couchmore Avenue | 196,564.00 | 901,387.00 | 1 |
| Courtlands Avenue | 356,473.00 | 1,634,792.00 | 1 |
| Coverts Road | 118,415.00 | 542,969.00 | 7 |
| Cranbrook Drive | 157,686.00 | 723,088.00 | 1 |
| Cranford Rise | 646,792.00 | 2,966,266.00 | 0 |
| Cranleigh Road | 256,157.00 | 1,174,705.00 | 1 |
| Crediton Way | 153,890.00 | 705,678.00 | 1 |
| Cumberland Drive | 248,507.00 | 1,140,898.00 | 0 |
| D'abernon Close | 345,752.00 | 1,585,620.00 | 1 |
| Dalmore Avenue | 188,779.00 | 865,682.00 | 0 |
| Denman Drive | 164,825.00 | 755,836.00 | 0 |
| Derwent Close | 226,913.00 | 1,040,582.00 | 0 |
| Dorchester Close | 254,080.00 | 1,165,191.00 | 2 |
| Douglas Road | 91,933.00 | 421,518.00 | 3 |
| Drakes Close | 336,878.00 | 1,544,930.00 | 0 |
| Eastmont Road | 171,244.00 | 785,264.00 | 1 |
| Elm Gardens | 192,136.00 | 881,085.00 | 1 |
| Elm Road | 136,384.00 | 625,376.00 | 0 |
| Elm Tree Avenue | 246,232.00 | 1,129,179.00 | 0 |
| Ember Lane | 260,299.00 | 1,193,691.00 | 4 |
| Esher Green | 217,898.00 | 999,231.00 | 0 |
| Esher Park Avenue | 441,384.00 | 2,024,205.00 | 3 |
| Esher Place Avenue | 423,271.00 | 1,941,129.00 | 0 |
| Fairlawn Close | 227,495.00 | 1,043,254.00 | 0 |
| Fairway Close | 218,635.00 | 1,002,625.00 | 0 |
| Farm Road | 67,841.00 | 311,026.00 | 3 |
| Fawcus Close | 230,708.00 | 1,057,992.00 | 0 |
| Fee Farm Road | 337,733.00 | 1,548,834.00 | 0 |
| Fir Tree Close | 477,102.00 | 2,188,022.00 | 0 |
| Firs Close | 57,601.00 | 264,055.00 | 0 |
| Fishersdene | 182,439.00 | 836,598.00 | 0 |
| Fitzalan Road | 336,163.00 | 1,541,646.00 | 0 |
| Foley Mews | 118,331.00 | 542,581.00 | 2 |
| Foley Road | 251,075.00 | 1,151,395.00 | 2 |
| Foley Wood | 260,631.00 | 1,195,220.00 | 0 |
| Forge Drive | 174,749.00 | 784,203.00 | 1 |
| Foxwarren | 91,506.00 | 419,564.00 | 4 |
| Gainsborough Close | 175,649.00 | 806,335.00 | 0 |
| Garden Villas | 230,708.00 | 1,057,992.00 | 0 |
| Garson Close | 230,708.00 | 1,057,992.00 | 0 |
| Garson Road | 116,618.00 | 534,739.00 | 0 |
| Glebelands | 90,478.00 | 414,841.00 | 0 |
| Glenavon Close | 137,854.00 | 632,119.00 | 0 |
| Gordon Road | 267,076.00 | 1,224,792.00 | 0 |
| Grantley Place | 392,914.00 | 1,801,914.00 | 0 |
| Green Mead | 225,283.00 | 1,033,120.00 | 0 |
| Greenways | 193,185.00 | 885,896.00 | 4 |
| Grove End Lane | 223,870.00 | 1,026,636.00 | 0 |
| Grove Way | 257,922.00 | 1,182,790.00 | 5 |
| Hampton Court Way | 230,708.00 | 1,057,992.00 | 0 |
| Hare Lane | 197,435.00 | 905,397.00 | 3 |
| Harefield | 169,888.00 | 779,050.00 | 2 |
| Haven Close | 185,159.00 | 849,079.00 | 0 |
| Haven Court | 105,506.00 | 483,758.00 | 0 |
| Haven Place | 256,780.00 | 1,177,556.00 | 0 |
| Hawkshill Close | 381,887.00 | 1,751,327.00 | 2 |
| Hawkshill Place | 416,738.00 | 1,911,181.00 | 0 |
| Hawkshill Way | 332,341.00 | 1,524,103.00 | 1 |
| Heatherset Close | 354,527.00 | 1,591,116.00 | 0 |
| Heathside | 182,803.00 | 838,225.00 | 2 |
| Heathside Close | 192,518.00 | 882,824.00 | 0 |
| Heathside | 182,803.00 | 838,255.00 | 2 |
| Heckets Court | 816,556.00 | 3,744,861.00 | 0 |
| Hengest Avenue | 150,910.00 | 692,018.00 | 1 |
| Hermitage Close | 201,157.00 | 922,456.00 | 1 |
| High Foleys | 359,361.00 | 1,648,013.00 | 1 |
| High Garth | 405,017.00 | 1,857,424.00 | 0 |
| High Street (Claygate) | 115,773.00 | 530,857.00 | 1 |
| High Street (Esher) | 137,457.00 | 630,298.00 | 0 |
| Hill Rise | 164,074.00 | 752,378.00 | 1 |
| Hillbrow Road | 175,290.00 | 803,833.00 | 1 |
| Hillcrest Gardens | 212,213.00 | 973,163.00 | 1 |
| Hillmont Road | 166,309.00 | 762,615.00 | 1 |
| Hillside | 179,953.00 | 825,203.00 | 0 |
| Hillview Road | 390,517.00 | 1,790,915.00 | 1 |
| Hinchley Close | 217,957.00 | 999,520.00 | 0 |
| Hinchley Drive | 200,728.00 | 920,494.00 | 0 |
| Hinchley Way | 183,525.00 | 841,605.00 | 0 |
| Holroyd Road | 77,365.00 | 354,717.00 | 2 |
| Home Farm Close | 376,804.00 | 1,728,035.00 | 1 |
| Homestead Gardens | 221,362.00 | 1,015,118.00 | 0 |
| Houston Place | 233,797.00 | 1,072,144.00 | 0 |
| Howitts Close | 383,862.00 | 1,760,387.00 | 0 |
| Hunting Close | 356,930.00 | 1,636,871.00 | 1 |
| Hurstbourne | 230,708.00 | 1,057,992.00 | ? |
| Imber Close | 97,039.00 | 444,935.00 | 0 |
| Imber Grove | 188,673.00 | 865,199.00 | 3 |
| Imber Park Road | 273,963.00 | 1,256,371.00 | 0 |
| Joseph Locke Way | 230,708.00 | 1,057,992.00 | 0 |
| Jubilee Villas, Weston Green | 140,124.00 | 642,538.00 | 1 |
| Judge Walk | 245,666.00 | 1,126,570.00 | 0 |
| Kilnside | 150,559.00 | 690,391.00 | 1 |
| King Georges Walk | 57,809.00 | 265,003.00 | 0 |
| Kings Mead Park | 283,096.00 | 1,298,252.00 | 0 |
| Lakeside Drive | 436,097.00 | 1,999,951.00 | 0 |
| Lane Gardens | 228,982.00 | 1,050,068.00 | 0 |
| Langbourne Way | 149,176.00 | 684,045.00 | 0 |
| Latton Close | 358,279.00 | 1,643,051.00 | 0 |
| Lammas Lane | 270,729.00 | 1,241,546.00 | 0 |
| Lime Tree Avenue | 203,902.00 | 935,047.00 | 0 |
| Little Orchard Place | 236,395.00 | 1,084,066.00 | 0 |
| Littlemead | 484,012.00 | 2,219,714.00 | 0 |
| Littleworth Avenue | 494,008.00 | 2,265,560.00 | 1 |
| Littleworth Common Road | 640,818.00 | 2,938,869.00 | 0 |
| Littleworth Lane | 686,777.00 | 3,149,653.00 | 0 |
| Littleworth Place | 230,708.00 | 1,057,992.00 | 0 |
| Littleworth Road | 407,087.00 | 1,866,908.00 | 1 |
| Loseberry Road | 182,965.00 | 839,032.00 | 0 |
| Lower Green Road | 157,918.00 | 724,149.00 | 3 |
| Lower Wood Road | 168,191.00 | 771,250.00 | 2 |
| Lynne Walk | 352,661.00 | 1,617,286.00 | 0 |
| Macaulay Avenue | 136,119.00 | 624,173.00 | 0 |
| Manor Drive | 191,396.00 | 877,682.00 | 1 |
| Manor Road North | 230,708.00 | 1,057,992.00 | 12 |
| Manor Road South | 233,455.00 | 1,070,587.00 | 16 |
| Martineau Close | 442,040.00 | 2,027,223.00 | 0 |
| Meadow Close | 196,719.00 | 902,110.00 | 0 |
| Meadow Road | 205,888.00 | 944,149.00 | 0 |
| Meadway | 698,540.00 | 3,203,618.00 | 1 |
| Medina Avenue | 163,701.00 | 750,671.00 | 1 |
| Melbury Close | 176,245.00 | 808,208.00 | 0 |
| Merrilyn Close | 217,816.00 | 998,836.00 | 0 |
| Milbourne Lane | 237,227.00 | 1,087,856.00 | 4 |
| Milbrook | 369,111.00 | 1,692,745.00 | 0 |
| Mill Road | 65,251.00 | 299,153.00 | 1 |
| Montgomery Avenue | 184,396.00 | 845,572.00 | 0 |
| More Lane | 224,147.00 | 1,027,893.00 | 1 |
| Mountview Road | 459,089.00 | 2,060,435.00 | 0 |
| Neville Close | 354,776.00 | 1,627,005.00 | 0 |
| New Road | 389,106.00 | 1,784,458.00 | 1 |
| Nightingale Road | 231,744.00 | 1,062,747.00 | 0 |
| Norfolk Road | 113,473.00 | 520,303.00 | 0 |
| Oak Tree Place | 162,616.00 | 745,711.00 | 0 |
| Oaken Drive | 197,647.00 | 906,364.00 | 1 |
| Oaken Lane | 202,777.00 | 929,884.00 | 1 |
| Oakhill | 199,715.00 | 915,843.00 | 0 |
| Oaklands Avenue | 275,378.00 | 1,262,851.00 | 0 |
| Old Claygate Lane | 153,678.00 | 704,712.00 | 1 |
| Orchard Gate | 408,366.00 | 1,872,772.00 | 0 |
| Orchard Way | 483,045.00 | 2,215,279.00 | 0 |
| Orleans Close | 154,170.00 | 706,945.00 | 0 |
| Park Close | 393,125.00 | 1,802,884.00 | 1 |
| Park Road | 128,877.00 | 590,963.00 | 1 |
| Park Square | 101,903.00 | 467,246.00 | 0 |
| Parkwood Avenue | 261,896.00 | 1,202,021.00 | 1 |
| Pelhams Close | 253,612.00 | 1,163,038.00 | 0 |
| Pelhams Walk | 354,694.00 | 1,626,612.00 | 1 |
| Pemberton Place | 238,565.00 | 1,094,030.00 | 0 |
| Poplar Road | 83,545.00 | 383,080.00 | 1 |
| Portsmouth Road | 178,011.00 | 816,309.00 | 2 |
| Pound Farm Close | 306,251.00 | 1,404,451.00 | 0 |
| Princess Square | 353,639.00 | 1,621,782.00 | 0 |
| Queen Anne Drive | 261,434.00 | 1,200,226.00 | 0 |
| Queens Close | 126,759.00 | 581,230.00 | 0 |
| Raleigh Drive | 266,767.00 | 1,223,366.00 | 0 |
| Raymond Way | 167,725.00 | 769,129.00 | 0 |
| Red Lane | 264,389.00 | 1,212,448.00 | 3 |
| Redruth Gardens | 351,264.00 | 1,610,891.00 | 0 |
| Riverside Drive | 301,789.00 | 1,383,965.00 | 0 |
| Rosebriars | 882,338.00 | 4,046,564.00 | 0 |
| Rosehill | 182,135.00 | 835,228.00 | 0 |
| Ruxley Crescent | 345,484.00 | 1,584,374.00 | 2 |
| Ruxley Ridge | 250,142.00 | 1,147,104.00 | 0 |
| Ruxley Towers | 315,588.00 | 1,447,272.00 | 0 |
| Rythe Close | 166,854.00 | 765,133.00 | 1 |
| Rythe Road | 172,353.00 | 790,343.00 | 1 |
| Sandon Close | 257,877.00 | 1,182,578.00 | 1 |
| Sandown Avenue | 817,143.00 | 3,747,556.00 | 1 |
| Sandown Gate | 184,906.00 | 847,932.00 | 0 |
| Sandown Road | 592,517.00 | 2,717,362.00 | 0 |
| Severn Drive | 177,210.00 | 812,616.00 | 3 |
| Sherriff Close | 73,838.00 | 338,535.00 | 4 |
| Simmil Road | 150,904.00 | 691,974.00 | 2 |
| Simmons Gate | 424,165.00 | 1,945,249.00 | 0 |
| Southwood Gardens | 215,852.00 | 989,852.00 | 1 |
| Spinney Gardens | 295,295.00 | 1,354,181.00 | 0 |
| St Georges Place | 651,531.00 | 2,988,004.00 | 1 |
| St Leonards Road | 237,318.00 | 1,088,314.00 | 2 |
| Station Approach | 72,493.00 | 332,351.00 | 2 |
| Station Road (Claygate) | 123,894.00 | 568,085.00 | 4 |
| Station Road (Esher) | 193,662.00 | 888,078.00 | 1 |
| Station Way | 98,196.00 | 450,238.00 | 0 |
| Stevens Lane | 256,651.00 | 1,176,978.00 | 2 |
| Stockfield Road | 203,781.00 | 934,490.00 | 0 |
| Sydney Terrace | 156,973.00 | 719,817.00 | 0 |
| Telegraph Lane | 145,124.00 | 665,473.00 | 3 |
| Tellisford | 268,681.00 | 1,232,155.00 | 0 |
| The Avenue | 264,408.00 | 1,212,549.00 | 1 |
| The Causeway | 241,841.00 | 1,109,027.00 | 0 |
| The Drive | 266,032.00 | 1,219,984.00 | 2 |
| The Elms | 85,498.00 | 391,999.00 | 0 |
| The Furlongs | 140,454.00 | 644,052.00 | 0 |
| The Gallops | 170,892.00 | 783,651.00 | 2 |
| The Gardens | 567,414.00 | 2,602,216.00 | 1 |
| The Green | 110,806.00 | 508,072.00 | 0 |
| The Maples | 302,454.00 | 1,387,046.00 | 0 |
| The Mews, Albany Crescent | 231,186.00 | 1,060,182.00 | 0 |
| The Mount | 614,383.00 | 2,817,631.00 | 0 |
| The Parade | 77,415.00 | 354,933.00 | 0 |
| The Roundway | 106,506.00 | 488,336.00 | 0 |
| The Rythe, Copsem Lane | 269,396.00 | 1,235,416.00 | 0 |
| The Willows, Albany Crescent | 90,357.00 | 414,280.00 | 1 |
| The Woodlands | 204,027.00 | 915,610.00 | 1 |
| Thomas More Gardens | 306,842.00 | 1,407,169.00 | 0 |
| Thorne Close | 178,531.00 | 818,687.00 | 3 |
| Torrington Close | 258,884.00 | 1,187,196.00 | 0 |
| Torrington Road | 200,337.00 | 918,703.00 | 1 |
| Tower Gardens | 245,319.00 | 1,124,986.00 | 1 |
| Trystings Close | 230,470.00 | 1,056,893.00 | 0 |
| Vale Croft | 249,044.00 | 1,142,082.00 | 0 |
| Vale Road | 150,692.00 | 691,009.00 | 1 |
| Vincent Close | 363,711.00 | 1,667,988.00 | 0 |
| Warren Close | 257,132.00 | 1,179,171.00 | 0 |
| Wayneflete Tower Avenue | 365,688.00 | 1,677,035.00 | 0 |
| West Acres | 349,941.00 | 1,570,529.00 | 0 |
| West End Gardens | 221,566.00 | 1,016,055.00 | 1 |
| West End Lane | 173,944.00 | 797,635.00 | 2 |
| Westbury Avenue | 234,569.00 | 1,075,680.00 | 0 |
| Westmont Road | 172,226.00 | 789,769.00 | 0 |
| Weston Green Road | 231,186.00 | 1,060,182.00 | 0 |
| Westwood Close | 292,583.00 | 1,341,769.00 | 0 |
| Willowmere | 365,400.00 | 1,675,724.00 | 0 |
| Winchester Close | 323,273.00 | 1,482,520.00 | 1 |
| Winterdown Gardens | 164,300.00 | 753,413.00 | 0 |
| Winterdown Road | 188,104.00 | 862,573.00 | 2 |
| Wolsey Grove | 94,384.00 | 432,486.00 | 1 |
| Wolsey Road | 188,220.00 | 863,127.00 | 1 |
| Woodbourne Drive | 193,866.00 | 889,026.00 | 0 |
| Woodend | 166,976.00 | 749,318.00 | 0 |
| Woodlands Close | 208,931.00 | 958,115.00 | 0 |
| Woodside Avenue | 238,266.00 | 1,092,643.00 | 1 |
| Woodstock Lane South | 231,186.00 | 1,060,182.00 | 0 |
| Woodward Close | 231,186.00 | 1,060,182.00 | 0 |
| Wootton Place | 738,251.00 | 3,385,740.00 | 0 |
TOP 25 ROADS BY VALUE INCREASE
Road Name |
Price Change 5 years (+) |
Current Average Value £ |
Number of transactinos last 12 months |
| Claremont Park Road | 986,560.00 | 4,524,574.00 | 0 |
| Blackhills | 911,204.00 | 4,178,955.00 | 1 |
| Rosebriars | 882,338.00 | 4,046,564.00 | 0 |
| Clare Hill | 831,726.00 | 3,814,436.00 | 1 |
| Sandown Avenue | 817,143.00 | 3,747,556.00 | 1 |
| Heckets Court | 816,556.00 | 3,744,861.00 | 0 |
| Wootton Place | 738,251.00 | 3,385,740.00 | 0 |
| Meadway | 698,540.00 | 3,203,618.00 | 1 |
| Littleworth Lane | 686,777.00 | 3,149,653.00 | 0 |
| St Georges Place | 651,531.00 | 2,988,004.00 | 1 |
| Cranford Rise | 646,792.00 | 2,966,266.00 | 0 |
| Littleworth Common Road | 640,818.00 | 2,938,869.00 | 0 |
| Claremont Drive | 637,611.00 | 2,924,477.00 | 1 |
| The Mount | 614,383.00 | 2,817,631.00 | 0 |
| Sandown Road | 592,517.00 | 2,717,362.00 | 0 |
| Acorns Way | 590,488.00 | 2,708,049.00 | 0 |
| The Gardens | 567,414.00 | 2,602,216.00 | 1 |
| Ashburnham Park | 532,347.00 | 2,389,218.00 | 0 |
| Arbrook Chase | 524,196.00 | 2,404,007.00 | 0 |
| Albany Close | 522,427.00 | 2,395,900.00 | 1 |
| Claremont End | 520,354.00 | 2,386,372.00 | 0 |
| Broom Close | 516,905.00 | 2,373,208.00 | 1 |
| Copsem Way | 509,949.00 | 2,338,662.00 | 0 |
| Littleworth Avenue | 494,008.00 | 2,265,560.00 | 1 |
| Littlemead | 484,012.00 | 2,219,714.00 | 0 |
TOP 25 LIST BY NUMBER OF COMPLETED TRANSACTIONS
Road Name |
Price Change 5 years (+) |
Current Average Value £ |
Number of transactions last 12 months |
| Manor Road South | 233,455.00 | 1,070,587.00 | 16 |
| Manor Road North | 230,708.00 | 1,057,992.00 | 12 |
| Coverts Road | 118,415.00 | 542,969.00 | 7 |
| Grove Way | 257,922.00 | 1,182,790.00 | 5 |
| Ember Lane | 260,299.00 | 1,193,691.00 | 4 |
| Milbourne Lane | 237,227.00 | 1,087,856.00 | 4 |
| Greenways | 193,185.00 | 885,896.00 | 4 |
| Avondale Avenue | 189,220.00 | 867,697.00 | 4 |
| Station Road (Claygate) | 123,894.00 | 568,085.00 | 4 |
| Foxwarren | 91,506.00 | 419,564.00 | 4 |
| Sherriff Close | 73,838.00 | 338,535.00 | 4 |
| Esher Park Avenue | 441,384.00 | 2,024,205.00 | 3 |
| Red Lane | 264,389.00 | 1,212,448.00 | 3 |
| Chestnut Avenue | 226,319.00 | 1,037,857.00 | 3 |
| Copsem Lane | 202,892.00 | 930,407.00 | 3 |
| Hare Lane | 197,435.00 | 905,397.00 | 3 |
| Imber Grove | 188,673.00 | 865,199.00 | 3 |
| Thorne Close | 178,531.00 | 818,687.00 | 3 |
| Severn Drive | 177,210.00 | 812,616.00 | 3 |
| Lower Green Road | 157,918.00 | 724,149.00 | 3 |
| Telegraph Lane | 145,124.00 | 665,473.00 | 3 |
| Common Road | 139,868.00 | 641,370.00 | 3 |
| Douglas Road | 91,933.00 | 421,518.00 | 3 |
| Farm Road | 67,841.00 | 311,026.00 | 3 |
| Hawkshill Close | 381,887.00 | 1,751,327.00 |
2 |
Most will already know that the KT10 postcode is home to some of the highest property values outside of London, mainly driven by demand from buyers moving out of London to Surrey for more outdoor space, excellent schools and a greater sense of community. Esher, Claygate and Hinchley Wood tick all of those boxes, so it is no surprise that those that move to the area, tend to stay here, and those moving out of London gravitate towards these locations.
GET AN ESTIMATED VALUE OF YOUR OWN PROPERTY IN 60 SECONDS.
BOOK A FREE FACE-TO-FACE VALUATION WITH ONE OF OUR AGENTS.
You may be thinking of moving, or more likely, you are just interested to know if the value of your property has gone up or down. It can be really difficult to guage what is happening with property values, some estate agents are always talking up the market, and the media is generally extremely negative and apocalyptic about the housing market around Surrey and London.
Let us cut out the rhetoric and the "sales spiel" and get down to some undeniable cold hard facts!
Transaction Levels
For most of us, it feels like 2008 was only yesterday, the recession hit and transaction levels went through the floor. As an example, the KT10 postcode area (Esher, Claygate, Hinchley Wood) dropped from over 400 annual transactions to just 184. Since then transactions have increased until the most recent peak in 2013 of 446 total transactions. There has been a steady decline in the number of transactions since then, and in 2017 the Land Registry recorded 354 transactions across Esher, Claygate and Hinchley Wood. The level of transactions has declined by 21% since the most recent peak in 2013, but has increased by 4% over the last year. Hardly a disaster story and by contrast to 2008 levels, a very healthy market place indeed.
A similar story applies to areas like Molesey and Thames Ditton, with transaction levels down 21% over a similar period, and still way above 2008 levels.There really is no comparison to the 2008 recession that has been quoted by some of the more dramatic media sources. To sum up, we are not at the "height" of a market trend but we predict prices to remain where they are for the next 2-3 years with modest fluctuations of around 5% +/- throughout this period.
Property Values
So you know transaction levels are still high, just not as high as they’ve been before, and we know what we're all really interested in… The value of property!
Last year property values across Molesey, Esher, Claygate, Hinchley Wood and Thames Ditton slipped slightly, with the lower end of the market dipping around 5% and the £1m + market dipping by 7% or more. This was purely down to affordability issues and scepticism from would be buyers. As a company, we experienced a market where buyers wanted to buy with interest rates at an all-time low, but sellers were still hoping for record breaking prices creating a gap that either the seller, or the buyer needed to fill. As the consumer dictates the price of a product by demand, this quickly formed a "buyers’ market" mentality, but once asking prices were adjusted, there were plenty of buyers for every property as they jumped at the chance to secure a reasonably priced home.
Since the beginning of 2018, house values have increased across all of the areas we cover: KT10 by 5%, KT8 by 3.14% and KT7 by 5.43%, this shows that the adjustment in asking prices last year from the majority of sellers created more competition from buyers and therefore, persuaded buyers to part with (or borrow) more cash to purchase their next home.
What we are still seeing is an extremely price sensitive marketplace, overestimating your property's value or listing with an agent purely because they provided you with a surprisingly high and intoxicating valuation, can cost you in the long run. Where properties remain on the market for longer than expected, buyers will assume you are desperate to sell and we have in extreme cases, received offers 15% below asking price. This will hinder your chances of getting market value and will make it nearly impossible for your agent to negotiate the best possible price for your property. Correct asking price = hordes of buyers = multiple offers = best price AND best position to proceed.
If you are thinking of selling, look at the sold history in your area on either Rightmove, Zoopla or Land Registry, asking prices are not always, what a property will sell for. Check how long a property has been on the market for, ask yourself why it hasn't sold if it has been on the market for months. Get multiple valuations from agents who have a good record of accomplishment in your area, listen to the facts and evidence rather than just listening to what you hope to hear. In an age where "fake news" has penetrated the majority of information sources, only the facts and evidence that you can verify matter, and that is all a buyer will consider – unless they fall in love with your property and have to submit a sealed bid because there are multiple interested parties! They are more likely to consult their mortgage broker than sold data at that stage!
If you are thinking of selling, would like clear advice on the value of your home and the best marketing strategy to adopt when and if you decide to sell, please call our sales team on either 0208 396 6717 or 01372 631 622 for more information. Alternatively, you can book a FREE valuation by clicking the link below.
BOOK A VALUATION
Are you considering selling or letting in Esher, Claygate or Hinchley Wood this spring? Our new KT10 branch is here to help!
Since Newton Huxley first opened its doors in East Molesey in January 2015, our model of "off the high street" estate agency has proven an effective one, leading us to become the areas most recommended estate agent in KT8 on Google. We now plan to achieve the same with our new KT10 office and would like to invite those looking to sell or let, to try our highly recommended sales and lettings services at a discounted rate, with potential savings for sellers of over £6000 and 30% off letting fees for a limited time only.
Our innovative marketing strategies, proactive culture and friendly staff all come together to give you the best experience whilst achieving the best possible result for your sale or let.
If you would like to arrange a FREE sales or lettings valuation of your property, please contact our KT10 office on 01372 631 622 or email esher@newtonhuxley.co.uk.
You can also request a valuation here.
Elevating the Elmbridge property market
Visit us in Molesey
East Molesey
Surrey
KT8 9ER
VISIT US IN ESHER
Claygate
Esher
Surrey
KT10 0PD