Thinking of selling soon? We'd love to help: BOOK A VALUATION
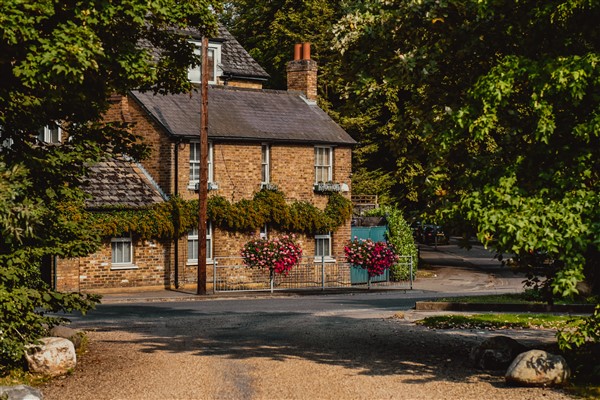
Our sales team did a fantastic job selling this property that had been marketed by 2 other agents over the last 13 months.
Within 6 weeks of them coming to market with Newton Huxley we had a buyer in place and have just exchanged contracts with the proud new owners of this stunning Edwardian property.
If you're looking to sell in Claygate my team can help, book a valuation here: https://lnkd.in/dtVWQds

Energy Performance Certificates (EPCs) were introduced in 2007 to give buyers a better understanding of the energy efficiency of a property they may wish to buy. The EPC is a legal requirement if you are selling or renting a property and are valid for 10 years from date of issue.
An EPC document includes an assessment of the current energy performance and estimated energy costs of the property as well as its potential future energy efficiency, if you were to implement the recommendations in the report.
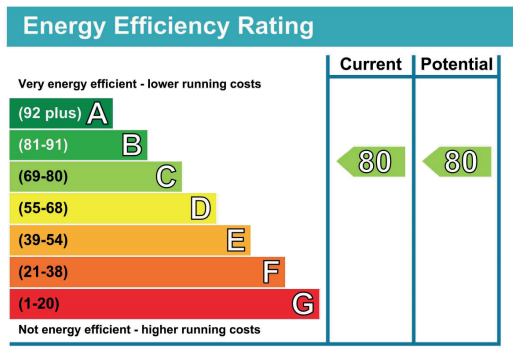
1.The EPC rating graphic
The ratings graphic shows how efficient your property is on a scale from A (very energy efficient to G (not very efficient). The higher the rating, the lower your potential energy costs will be.
Each letter is also assigned to a group of numbers (from 1 to 100). The higher up the scale, the better the property's efficiency. The first of two arrows shows the propertys current rating, whilst the second highlights the property’s potential rating if more energy-efficient features were to be installed.
The average EPC rating for a home in the UK is D.
The report goes on to details the changes you could make to improve the energy efficiency of the property, as well as detailing the estimated costs and potential savings you could make.
Who needs an EPC?
Sellers : It's a legal requirement to have an EPC for your home, before you sell it. You can arrange it through your Estate Agent, or directly with an EPC provider. The EPC register lists approved providers: https://www.epcregister.com/
Buyers. You should receive a copy of the EPC from the seller. Which you can use to plan energy efficiency improvements to the property or to negotiate the property price you pay.
Landlords. It is a legal requirement for buy-to-let properties to have an energy efficiency rating of E or above, before you can take on a new tenant or renew an existing contract. Later this year the rule will apply to existing tenancy agreements too.
Tenants. You should receive a copy of the EPC for the property you are renting. It will help you plan and budget for energy costs.
How can you improve the energy efficiency of your home?
- Insulate your floors, roof, loft and walls. Good quality insulation reduces the need for heating, which in turn reduces your energy consumption.
- Double glazing: heat is rapidly lost through single glazed windows. Double-glaze them to reduce your energy consumption.
- Solar panels: the cost for these is reducing and they can provide cheaper, greener energy.
- Low-energy lighting: low cost and easy to install, with no structural alterations required, low-energy light bulbs is a cheap, easy way to lower your energy bills.

According to the Federation of Master Builders (FMB) and the Home Owners Alliance (HOA), you can enhance the value of your property by almost £50,000 simply by removing an internal wall to create an open plan kitchen and dining area.
Chief executive of the FMB, Brian Berry, said the work would cost less than £3,500, take seven days to carry out, and would add £48,417 to an averagely priced home in London.
"By investing in low-cost, high-return projects, not only will you make your home a more pleasant place to live, you’ll also be increasing its value significantly. Better still, these projects take no time at all so the hassle factor will be kept to an absolute minimum," he said.
But what if this isn't an option? What other projects could you invest in to significantly add value in a short amount of time? Here are some options:
- Build a garden room or outside playroom. Typical costs for this project will be in the region of £6,500, but will add an average (in Surrey) of over £35,000. A massive £28.5k profit.
- Update your kitchen. With careful planning this could cost in the region of £4,000, but could add almost £27,000 to the value of your property.
- Turn a cupboard into a downstairs toilet. With an initial outlay of just over £2,500 it could add up to £24,000 to the value of your property
- Add an en-suite bathroom. Converting part of a bedroom into a a bathroom can cost as little as £4,700, but add in excess of £14,500 to the value of your home.
- Add a driveway. If you have the space, buyers will pay more for a property with added parking space. For an investment of £2,200 you could add £13,300 to the value of your property.
- Install decking. For just under £4,000 you could add decking and lighting generating additional value of up to £9,000.
Potential returns will vary by property and location. Contact us if you'd like specific advise, before you invest the money.
If you're thinking about buying a new home, you'll need to budget for more than just the deposit. It's a stressful time, saving! You work hard to put away savings each month and feel like celebrating when you have saved enough for that all important deposit. But don't get carried away too early, as there are other costs that you need to take into account!
When you're working out your 'buying a house' budget, you also need to take account of the cost of buying, your mortgage fees and moving costs – on top of your deposit. It all adds up and can easily plunge you into debt if an unexpected bill hasn't been taken into account.
Here's what you need to know about and budget for:
- Mortgage fees. On top of your deposit you need to take account of the charges that your mortgage provider will require as part of the application process. These can vary from a few hundred pounds to several thousand pounds. Shop around to get the best possible deal. Also bear in mind that an electronic transfer fee is often applicable when the mortgage is paid out. This is often in the region of £50.
- Surveyors fees. You may view this as a necessary evil in order to comply with your mortgage, but having a professional survey could save you thousands in the longer run. A basic survey could be as little as £250 to £300, but really amounts to little more than a valuation. Paying extra for a homebuyers report, or even a full structural survey, could identify issues that enables you to renegotiate the price or save you money and headaches in the longer term.
- Legal fees. You will need a solicitor to carry out the legal searches on your property; to identify if a new motorway is likely to be built alongside your new property, for example. Fees for these are typically less than £250. Whilst the paperwork for the purchase of your property could cost £1000 to £1500.
- Stamp duty. Depending upon the purchase price of your property you will need to pay stamp duty to the Government. If you are a first time buyer you won't pay stamp duty on the first £300,000. Whilst you are only exempt from paying stamp duty on the first £125,000 if you are not a first time buyer.
Rate
Charge Band
0%
Up to £125,000
First-time buyers: first £300,000 for property up to £500,000
2%
Over £125,000 to £250,000
5%
Over £250,000 to £925,000
10%
Over £925,000 to £1,500,000
12%
Over £1,500,000
- Estate Agent fees. You only pay estate agent fees of you are selling a property. So if you are a first time buyer, you shouldn't need to budget for Estate Agent fees. If you are selling, the fees are typically one to three per cent of the final sales price. With VAT usually chargeable on top of that.
- Moving costs. Unless you are prepared to rent a van and move yourself, you will need to budget for a professional removal company to move your possessions. Fees are typically £400 to £600.
- Decorations and refurbishment costs. It's worth being clear exactly what is included within the sale. If you need to buy carpets, curtains, curtain rails and more, these can quickly eat into your budget. Even a fresh lick of paint can add up. And that's before any more extensive refurbishments that may be required. Where possible get quotes up front, so you know what costs will be applicable after you've purchased the property.
- Rates. And finally, make sure you know what rates are payable (to your Local Authority) for the property that you are purchasing. As this can often be another overlooked cost.
Buying and selling a home can be a stressful process, so it's important you are aware of the pitfalls that can cause a sale (or rental) to fall though. If you address these early in the process your chances of the deal going through is much greater.
According to the NAEA (National Association of Estate Agents) Propertymark, these are the factors that most commonly cause issues:
1. Nuisance neighbours. If you've had an issue with a neighbour eg over boundaries, shared access or anti-social noise you're better off being honest early in the process rather than risk it affecting things later down the line.
2. Structural problems. If you know of any structural problems with your property, you should fix them straightaway. Or, as a minimum, get a contractor to provide an estimate for the work, so this can be included as part of the negotiation.
3. Japanese knotweed. This invasive plant has deep roots that can damage the foundations of properties. If you think you have any, call a professional to get rid of it. Not only can it significantly devalue your property, it puts it at risk of subsidence and could affect the ability to get a mortgage on the property.
4. Rail timetable changes. If you're within a commuter belt. Changes to timetables can affect the saleability (or rental) of your property.
5. Planning permission. Have you had any work carried out on your property whilst you've been living there? Such as extensions or conversions? If you have, make sure you have all the documents you need to prove they have been completed in accordance with local planning regulations.
6. Remaining lease length. If your property has a short lease time remaining, you should provide this information as early as possible.
7. Flight paths. Noise form airports is cited as one of the common reasons why a purchase fails to go through. Be honest with prospective purchasers (or tenants) about how much you can hear and at what time of day you're disrupted.
8. Parking disputes. If you have a dispute with a neighbour over street parking or shared driveways, try to resolve them with your neighbour first. If necessary, check the deeds of your property to see where boundaries lie.
9. School catchment areas. This is one of the most important factors for parents of school age children. Make sure you are up-to-date with the local schools, so you can advise if your property falls within the catchment areas.
10. Damp. Not only can damp cause damage to a property it can also be a health risk. Most cases of damp are simple and inexpensive to fix. If you're concerned get a specialist company in who can advise what works need carrying out and the potential costs. You may need to factor this into the sale price of your home.
It's long been understood that colour has the power to transform behaviour and shape the way that we perceive a wide variety of goods and services. Businesses spend millions in branding and marketing to encourage us to chose their brand above others.
In our homes, we also use colour to affect the mood and ambience of each room. With brands such as Dulux investing heavily in the branding of colours to reflect the style, heritage and personality that we want to portray.
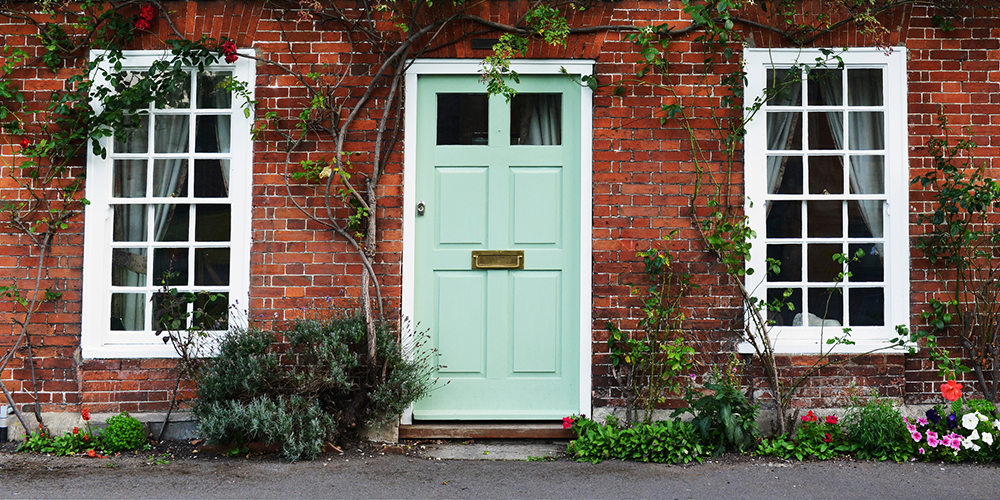
One of the most often overlooked items, when considering our colour schemes, is the colour of the humble front door. Yet this is one of the first things that potential buyers or tenants will see. Helping them form an impression of your property, long before they step through the front door.
Current colour trends typically take property owners down one of two roads. Bright yellow, pink and turquoise are very much on trend, giving properties a wow factor with a flash of vivid colour. The other option, also popular, is to adopt a more traditional, subtle, muted colour such as deep blue, dark grey and sage green. As timeless colours they help create an impressions of style and heritage.
So, can the colour of our front door influence the potential sale or letting of your home? Many agents think so. But, it would appear, that the choice of colour is dependent upon where you live.
Here's what Country Life suggest:
- If you live in the country or in a country village, avoid paint altogether. Instead use varnish on bare wood to compliment the countryside.
- If you live by the sea, chose a colour that matches the ocean.
- If your property is constructed in yellow sandstone a duck-egg clue can be appealing
- If your property is constructed with brick, adding a contrasting colour such as deep blue is popular.
Taking all of the above into account, according to Country Life's research blue is the most popular colour when it comes to selling or letting a property.

Historically, the Christmas and New Year holidays see record visits to sites such as Rightmove and Zoopla, with over 1.6m properties viewed online as people escape the Christmas turkey to think about their next move.
Understandably, many people are reluctant to sell or let their property until after the New Year. But, if you are thinking of moving, selling or letting a property in January, can you afford not to put your property in front of potential buyers at this important time of year?
Even if your property is listed with an agent, you don't have to conduct viewings, if you don't want to. The likelihood is that potential buyers or tenants would prefer to wait until the New Year anyway. Instead, get your property listed, so you're ready to take action as soon as the holiday season is over.
Here's what we recommend:
- Book your market appraisal now. We can discuss with you a strategy to get your property in front of buyers or tenants by the 21st December, so that your listing is available for all those buyers researching over Christmas.
- Get your home ready for selling. Use your preparations for Christmas as a time to de-clutter and to fix those DIY jobs.
- Get your paperwork in order. Get your payslips, bank statements, tax returns and employment contracts together, so you are ready to apply for your next mortgage, demonstrate that you have the funds in place for your next property or be able to quickly complete the tenant application process.
- Get a surveyor lined up to complete a survey on your property. Unless you are buying a new property, which will come with all or some of a 10 year NHBC guarantee, chances are that you will need some form of survey completing on your next property. Use the run-up to Christmas to decide who you are going to use and what type of survey you are going to undertake.
If you are thinking of selling or letting before or just after Christmas, planning ahead will ensure you get a head start in the New Year, will ensure your property is in front of potential buyers over the Christmas break and still enables you to enjoy family time without disruption. Voila!
Get in touch today, if you'd like to arrange a free market appraisal of your property.
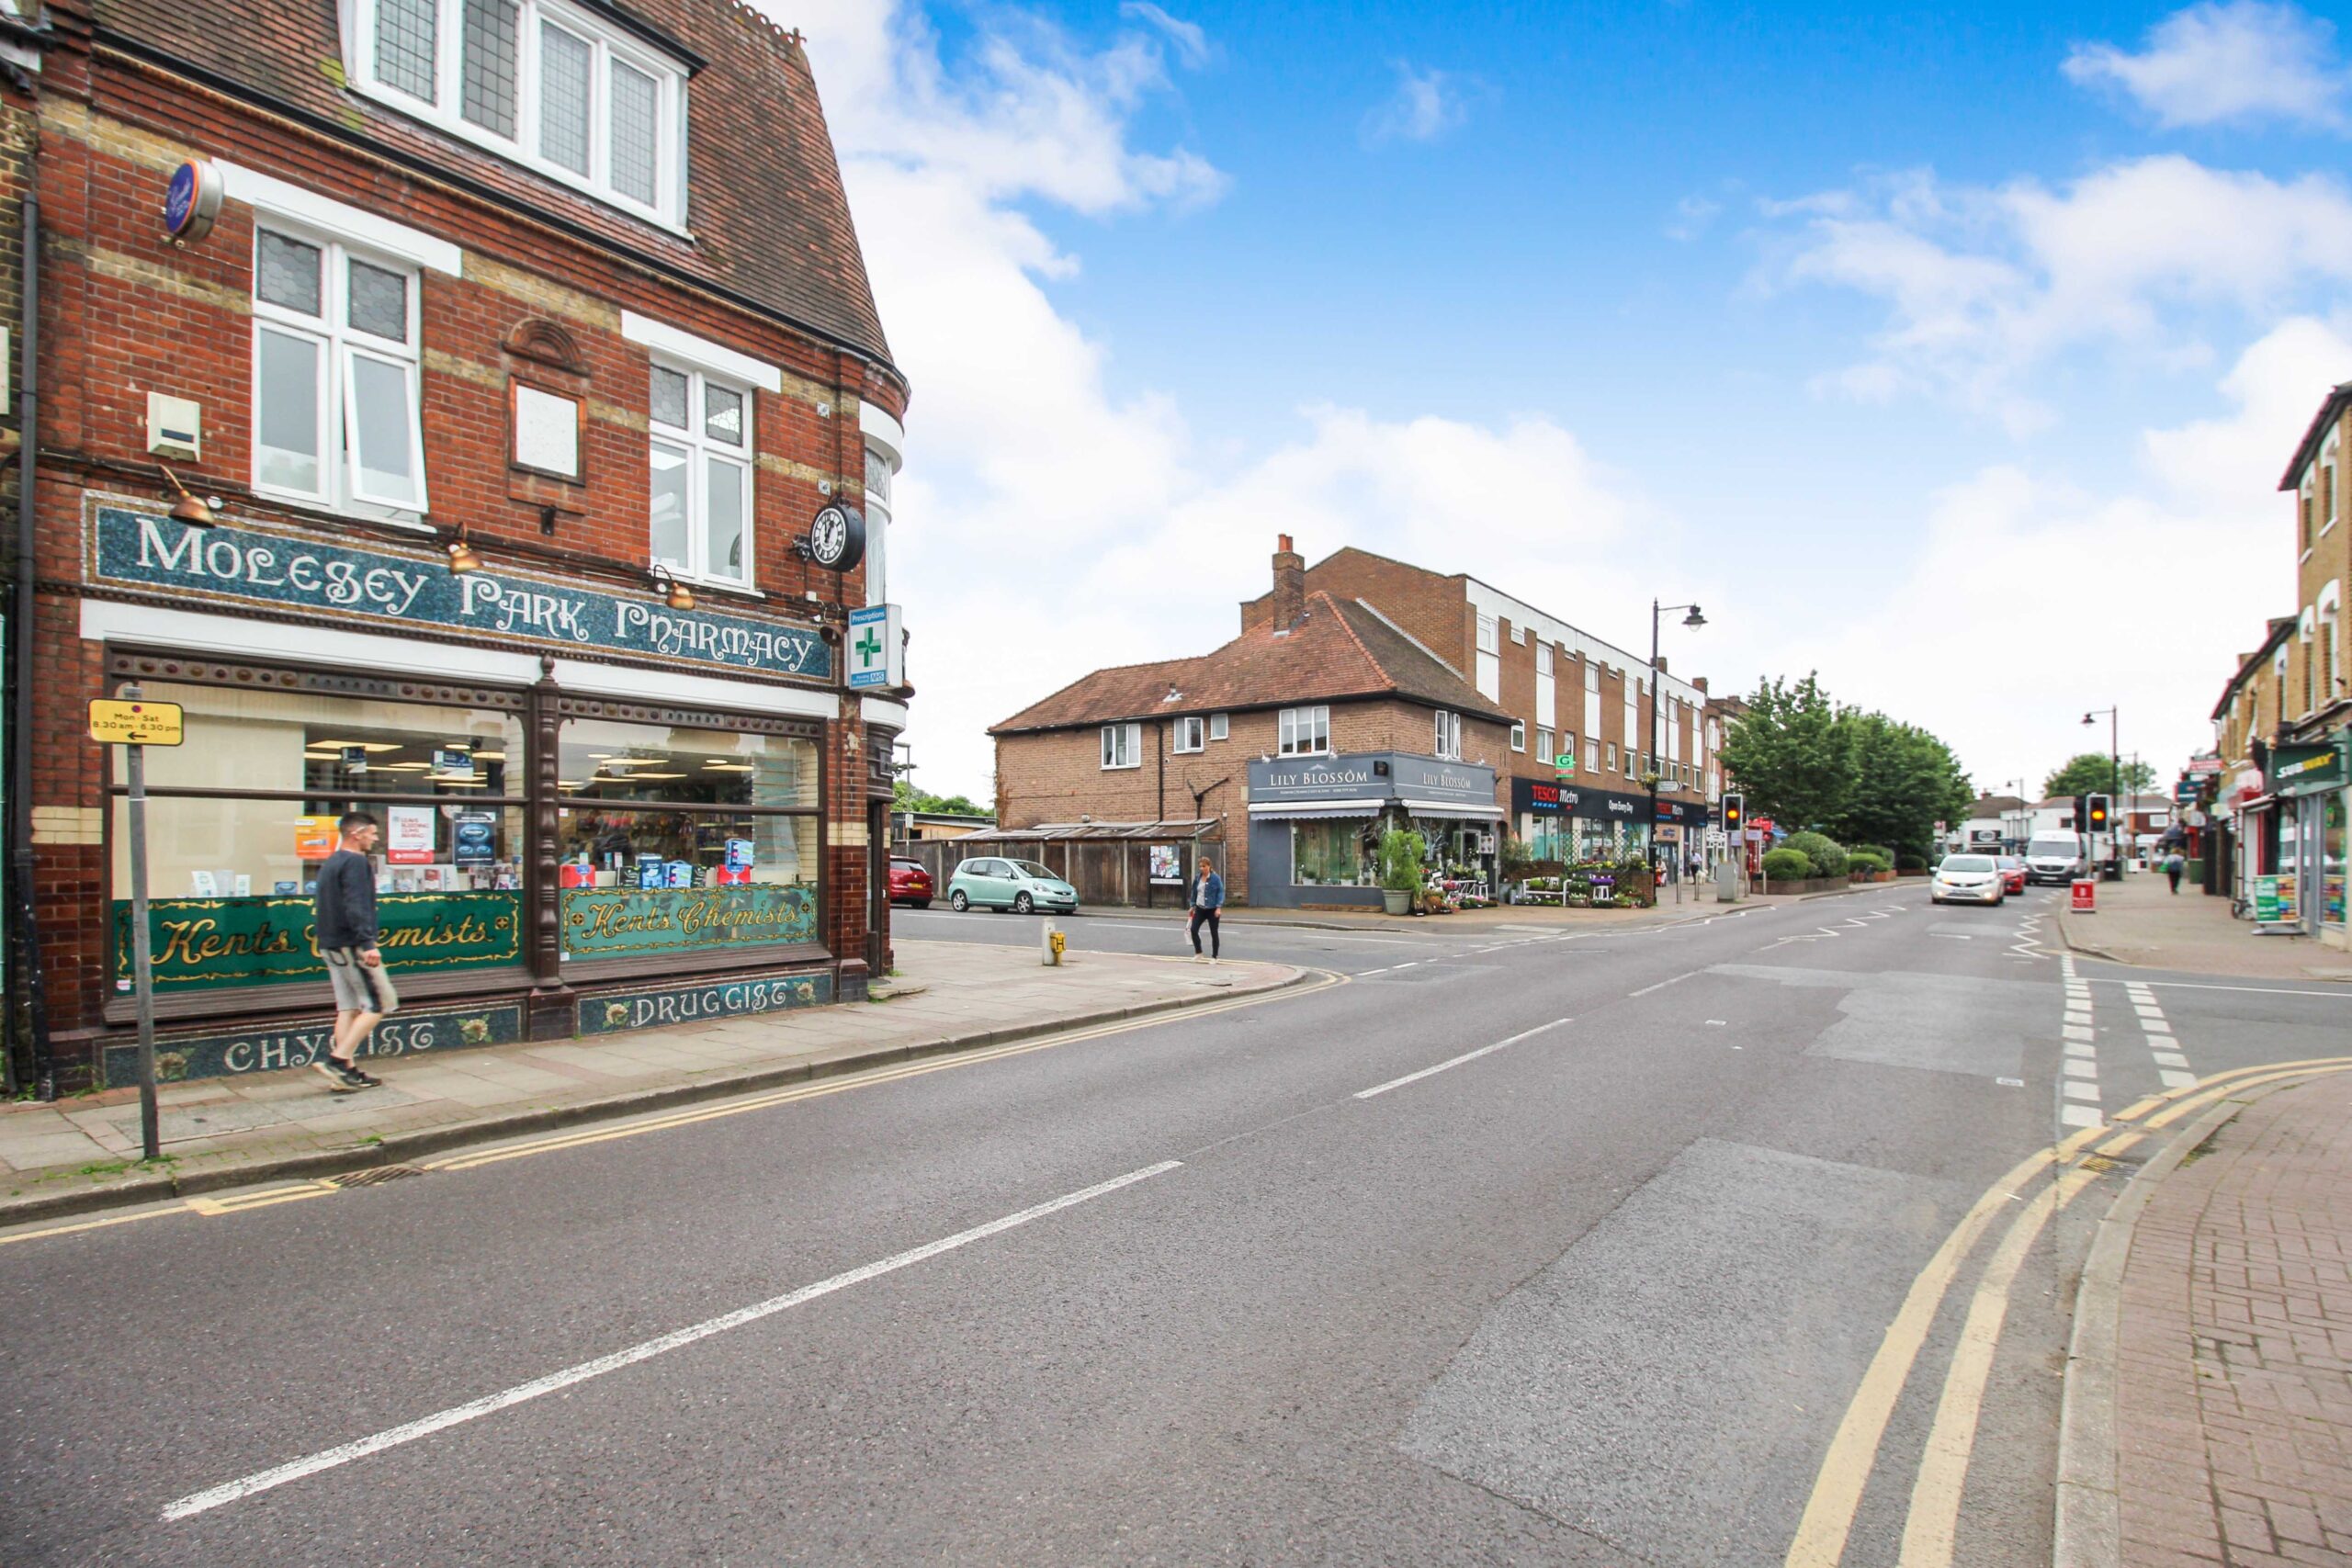
Once again we have been trawling the land registry to gain further insight into the Molesey housing market. For many it has been a year of uncertainty and we are delighted to deliver some clarity to value and transaction trends in the Molesey area.
Hopefully you find the below statistics interesting, but if you would like to obtain an instant valuation of your own property, you can do so by clicking here:
FIND THE VALUE OF YOUR PROPERTY IN 60 SECONDS
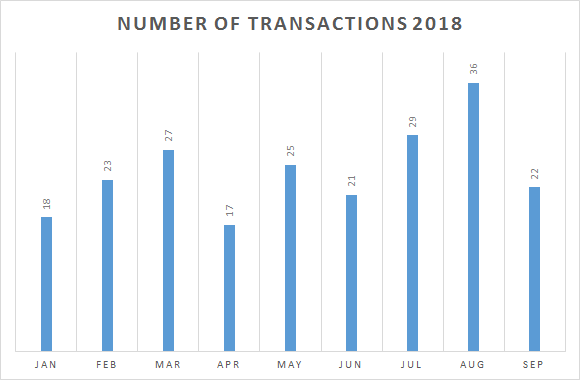
At the time of publishing this article the last full month of completed transactions submitted by the land registry was September 2018.
There were 658 new listings uploaded to Rightmove.co.uk between the 1st January – 3rd December 2018
Out of those 658 listings in Molesey (KT8 postcode), 49% reduced their asking price, and 43% of the total listings agreed a sale.
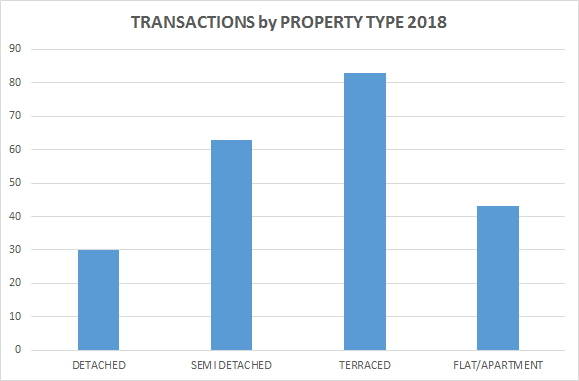
The number of completed transactions on record has remained in line with predictions at the begining of the year:
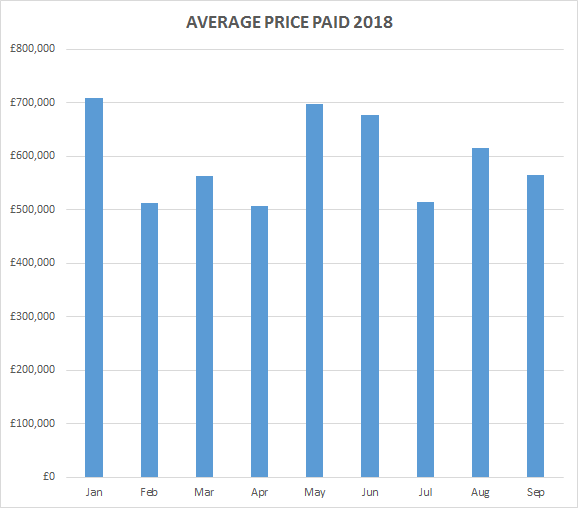
The average price paid has remained strong due to a lack of supply to the Molesey market, and a continued influx of buyers moving out of central and SW London.
Terraced properties have the highest transaction rate in terms of property type, which is consistent with expectations given the number of terraced homes in Molesey.
We have also calculated the transaction rate for the top 10 roads in Molesey. This is calculated as a percentage of the total properties on the road, as opposed to the total number.
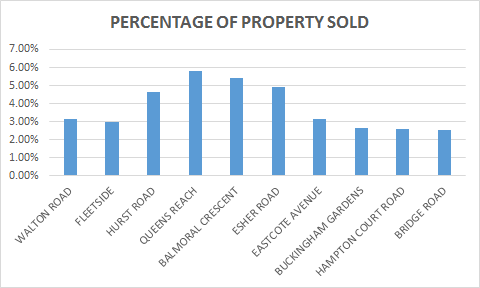
Transaction levels remain surpressed, but values remain high.
If you are looking for more space and would like to upsize and sell your current property. Now is the perfect time to do so.
FIND THE VALUE OF YOUR PROPERTY IN 60 SECONDS
If you live in either Esher, Claygate or Hinchley Wood, you may be interested in average property values. If you are looking to buy in the area, you may be interested to know the average value of a property in your favoured roads. We have it covered with our comprehensive list of average property values, increase over the last 5 years, and the number of completed transactions over the last 12 months.
Given there are nearly 300 roads accross the KT10 postcode area, we have listed each road in alphabetical order, with a top 25 list for price increase, and a top 25 list for number of completed transactions.
GET AN ESTIMATED VALUE OF YOUR OWN PROPERTY IN 60 SECONDS.
Road Name |
Price Change 5 years (+) |
Current Average Value £ |
Number of transactions last 12 months |
| Acorns Way | 590,488.00 | 2,708,049.00 | 0 |
| Albany Close | 522,427.00 | 2,395,900.00 | 1 |
| Albany Crescent | 160,764.00 | 737,201.00 | 0 |
| Alma Road | 111,761.00 | 512,452.00 | 1 |
| Applegarth | 194,498.00 | 891,925.00 | 1 |
| Arbrook Chase | 524,196.00 | 2,404,007.00 | 0 |
| Arbrook Lane | 303,358.00 | 1,391,204.00 | 0 |
| Arran Way | 100,004.00 | 458,539.00 | 0 |
| Ashburnham Park | 532,347.00 | 2,389,218.00 | 0 |
| Ashton Place | 135,507.00 | 621,357.00 | 0 |
| Aston Road | 105,648.00 | 484,421.00 | 0 |
| Avondale Avenue | 189,220.00 | 867,697.00 | 4 |
| Beaconsfield Gardens | 387,365.00 | 1,776,462.00 | 0 |
| Belvedere Close | 80,813.00 | 370,531.00 | 0 |
| Berkeley Gardens | 282,944.00 | 1,297,568.00 | 0 |
| Blackhills | 911,204.00 | 4,178,955.00 | 1 |
| Blair Avenue | 98,327.00 | 450,840.00 | 1 |
| Blakeden Drive | 98,327.00 | 450,840.00 | 1 |
| Bracondale | 360,545.00 | 1,653,465.00 | 0 |
| Brendon Close | 270,073.00 | 1,238,528.00 | 1 |
| Brendon Drive | 290,118.00 | 1,330,454.00 | 0 |
| Bridle Road | 174,801.00 | 801,572.00 | 0 |
| Brisson Close | 203,965.00 | 935,330.00 | 0 |
| Brookfield Gardens | 102,794.00 | 471,338.00 | 0 |
| Broom Close | 516,905.00 | 2,373,208.00 | 1 |
| Burns Terrace | 230,708.00 | 1,057,992.00 | 0 |
| Caerleon Close | 260,637.00 | 1,195,252.00 | 0 |
| Carleton Close | 202,486.00 | 928,546.00 | 0 |
| Carrick Gate | 293,371.00 | 1,345,374.00 | 0 |
| Carrington Place, Esher Park Ave | 286,975.00 | 1,315,208.00 | 1 |
| Cavendish Drive | 186,290.00 | 854,265.00 | 1 |
| Cedar Close | 284,021.00 | 1,302,495.00 | 0 |
| Cedar Walk | 353,869.00 | 1,622,832.00 | 0 |
| Chadworth Way | 239,942.00 | 1,100,337.00 | 1 |
| Charlotte Court | 427,591.00 | 1,960,944.00 | 0 |
| Charlotte Mews | 88,100.00 | 403,932.00 | 0 |
| Chesterfield Drive | 219,573.00 | 1,006,927.00 | 0 |
| Chestnut Avenue | 226,319.00 | 1,037,857.00 | 3 |
| Church Road | 142,497.00 | 653,428.00 | 0 |
| Church Street | 107,713.00 | 493,909.00 | 0 |
| Clare Hill | 831,726.00 | 3,814,436.00 | 1 |
| Claremont Avenue | 263,740.00 | 1,209,474.00 | 0 |
| Claremont Drive | 637,611.00 | 2,924,477.00 | 1 |
| Claremont End | 520,354.00 | 2,386,372.00 | 0 |
| Claremont Lane | 350,740.00 | 1,608,489.00 | 0 |
| Claremont Park Road | 986,560.00 | 4,524,574.00 | 0 |
| Claremont Road | 333,072.00 | 1,527,452.00 | 0 |
| Claygate Lane | 215,813.00 | 989,667.00 | 1 |
| Claygate Lodge Close | 230,708.00 | 1,057,992.00 | 1 |
| Clive Road | 415,689.00 | 1,906,358.00 | 1 |
| Common Lane | 372,830.00 | 1,709,801.00 | 0 |
| Common Road | 139,868.00 | 641,370.00 | 3 |
| Compton Close | 230,708.00 | 1,057,992.00 | 0 |
| Copsem Lane | 202,892.00 | 930,407.00 | 3 |
| Copsem Way | 509,949.00 | 2,338,662.00 | 0 |
| Cornwall Avenue | 217,939.00 | 999,432.00 | 0 |
| Cotswold Close | 226,419.00 | 1,038,302.00 | 1 |
| Couchmore Avenue | 196,564.00 | 901,387.00 | 1 |
| Courtlands Avenue | 356,473.00 | 1,634,792.00 | 1 |
| Coverts Road | 118,415.00 | 542,969.00 | 7 |
| Cranbrook Drive | 157,686.00 | 723,088.00 | 1 |
| Cranford Rise | 646,792.00 | 2,966,266.00 | 0 |
| Cranleigh Road | 256,157.00 | 1,174,705.00 | 1 |
| Crediton Way | 153,890.00 | 705,678.00 | 1 |
| Cumberland Drive | 248,507.00 | 1,140,898.00 | 0 |
| D'abernon Close | 345,752.00 | 1,585,620.00 | 1 |
| Dalmore Avenue | 188,779.00 | 865,682.00 | 0 |
| Denman Drive | 164,825.00 | 755,836.00 | 0 |
| Derwent Close | 226,913.00 | 1,040,582.00 | 0 |
| Dorchester Close | 254,080.00 | 1,165,191.00 | 2 |
| Douglas Road | 91,933.00 | 421,518.00 | 3 |
| Drakes Close | 336,878.00 | 1,544,930.00 | 0 |
| Eastmont Road | 171,244.00 | 785,264.00 | 1 |
| Elm Gardens | 192,136.00 | 881,085.00 | 1 |
| Elm Road | 136,384.00 | 625,376.00 | 0 |
| Elm Tree Avenue | 246,232.00 | 1,129,179.00 | 0 |
| Ember Lane | 260,299.00 | 1,193,691.00 | 4 |
| Esher Green | 217,898.00 | 999,231.00 | 0 |
| Esher Park Avenue | 441,384.00 | 2,024,205.00 | 3 |
| Esher Place Avenue | 423,271.00 | 1,941,129.00 | 0 |
| Fairlawn Close | 227,495.00 | 1,043,254.00 | 0 |
| Fairway Close | 218,635.00 | 1,002,625.00 | 0 |
| Farm Road | 67,841.00 | 311,026.00 | 3 |
| Fawcus Close | 230,708.00 | 1,057,992.00 | 0 |
| Fee Farm Road | 337,733.00 | 1,548,834.00 | 0 |
| Fir Tree Close | 477,102.00 | 2,188,022.00 | 0 |
| Firs Close | 57,601.00 | 264,055.00 | 0 |
| Fishersdene | 182,439.00 | 836,598.00 | 0 |
| Fitzalan Road | 336,163.00 | 1,541,646.00 | 0 |
| Foley Mews | 118,331.00 | 542,581.00 | 2 |
| Foley Road | 251,075.00 | 1,151,395.00 | 2 |
| Foley Wood | 260,631.00 | 1,195,220.00 | 0 |
| Forge Drive | 174,749.00 | 784,203.00 | 1 |
| Foxwarren | 91,506.00 | 419,564.00 | 4 |
| Gainsborough Close | 175,649.00 | 806,335.00 | 0 |
| Garden Villas | 230,708.00 | 1,057,992.00 | 0 |
| Garson Close | 230,708.00 | 1,057,992.00 | 0 |
| Garson Road | 116,618.00 | 534,739.00 | 0 |
| Glebelands | 90,478.00 | 414,841.00 | 0 |
| Glenavon Close | 137,854.00 | 632,119.00 | 0 |
| Gordon Road | 267,076.00 | 1,224,792.00 | 0 |
| Grantley Place | 392,914.00 | 1,801,914.00 | 0 |
| Green Mead | 225,283.00 | 1,033,120.00 | 0 |
| Greenways | 193,185.00 | 885,896.00 | 4 |
| Grove End Lane | 223,870.00 | 1,026,636.00 | 0 |
| Grove Way | 257,922.00 | 1,182,790.00 | 5 |
| Hampton Court Way | 230,708.00 | 1,057,992.00 | 0 |
| Hare Lane | 197,435.00 | 905,397.00 | 3 |
| Harefield | 169,888.00 | 779,050.00 | 2 |
| Haven Close | 185,159.00 | 849,079.00 | 0 |
| Haven Court | 105,506.00 | 483,758.00 | 0 |
| Haven Place | 256,780.00 | 1,177,556.00 | 0 |
| Hawkshill Close | 381,887.00 | 1,751,327.00 | 2 |
| Hawkshill Place | 416,738.00 | 1,911,181.00 | 0 |
| Hawkshill Way | 332,341.00 | 1,524,103.00 | 1 |
| Heatherset Close | 354,527.00 | 1,591,116.00 | 0 |
| Heathside | 182,803.00 | 838,225.00 | 2 |
| Heathside Close | 192,518.00 | 882,824.00 | 0 |
| Heathside | 182,803.00 | 838,255.00 | 2 |
| Heckets Court | 816,556.00 | 3,744,861.00 | 0 |
| Hengest Avenue | 150,910.00 | 692,018.00 | 1 |
| Hermitage Close | 201,157.00 | 922,456.00 | 1 |
| High Foleys | 359,361.00 | 1,648,013.00 | 1 |
| High Garth | 405,017.00 | 1,857,424.00 | 0 |
| High Street (Claygate) | 115,773.00 | 530,857.00 | 1 |
| High Street (Esher) | 137,457.00 | 630,298.00 | 0 |
| Hill Rise | 164,074.00 | 752,378.00 | 1 |
| Hillbrow Road | 175,290.00 | 803,833.00 | 1 |
| Hillcrest Gardens | 212,213.00 | 973,163.00 | 1 |
| Hillmont Road | 166,309.00 | 762,615.00 | 1 |
| Hillside | 179,953.00 | 825,203.00 | 0 |
| Hillview Road | 390,517.00 | 1,790,915.00 | 1 |
| Hinchley Close | 217,957.00 | 999,520.00 | 0 |
| Hinchley Drive | 200,728.00 | 920,494.00 | 0 |
| Hinchley Way | 183,525.00 | 841,605.00 | 0 |
| Holroyd Road | 77,365.00 | 354,717.00 | 2 |
| Home Farm Close | 376,804.00 | 1,728,035.00 | 1 |
| Homestead Gardens | 221,362.00 | 1,015,118.00 | 0 |
| Houston Place | 233,797.00 | 1,072,144.00 | 0 |
| Howitts Close | 383,862.00 | 1,760,387.00 | 0 |
| Hunting Close | 356,930.00 | 1,636,871.00 | 1 |
| Hurstbourne | 230,708.00 | 1,057,992.00 | ? |
| Imber Close | 97,039.00 | 444,935.00 | 0 |
| Imber Grove | 188,673.00 | 865,199.00 | 3 |
| Imber Park Road | 273,963.00 | 1,256,371.00 | 0 |
| Joseph Locke Way | 230,708.00 | 1,057,992.00 | 0 |
| Jubilee Villas, Weston Green | 140,124.00 | 642,538.00 | 1 |
| Judge Walk | 245,666.00 | 1,126,570.00 | 0 |
| Kilnside | 150,559.00 | 690,391.00 | 1 |
| King Georges Walk | 57,809.00 | 265,003.00 | 0 |
| Kings Mead Park | 283,096.00 | 1,298,252.00 | 0 |
| Lakeside Drive | 436,097.00 | 1,999,951.00 | 0 |
| Lane Gardens | 228,982.00 | 1,050,068.00 | 0 |
| Langbourne Way | 149,176.00 | 684,045.00 | 0 |
| Latton Close | 358,279.00 | 1,643,051.00 | 0 |
| Lammas Lane | 270,729.00 | 1,241,546.00 | 0 |
| Lime Tree Avenue | 203,902.00 | 935,047.00 | 0 |
| Little Orchard Place | 236,395.00 | 1,084,066.00 | 0 |
| Littlemead | 484,012.00 | 2,219,714.00 | 0 |
| Littleworth Avenue | 494,008.00 | 2,265,560.00 | 1 |
| Littleworth Common Road | 640,818.00 | 2,938,869.00 | 0 |
| Littleworth Lane | 686,777.00 | 3,149,653.00 | 0 |
| Littleworth Place | 230,708.00 | 1,057,992.00 | 0 |
| Littleworth Road | 407,087.00 | 1,866,908.00 | 1 |
| Loseberry Road | 182,965.00 | 839,032.00 | 0 |
| Lower Green Road | 157,918.00 | 724,149.00 | 3 |
| Lower Wood Road | 168,191.00 | 771,250.00 | 2 |
| Lynne Walk | 352,661.00 | 1,617,286.00 | 0 |
| Macaulay Avenue | 136,119.00 | 624,173.00 | 0 |
| Manor Drive | 191,396.00 | 877,682.00 | 1 |
| Manor Road North | 230,708.00 | 1,057,992.00 | 12 |
| Manor Road South | 233,455.00 | 1,070,587.00 | 16 |
| Martineau Close | 442,040.00 | 2,027,223.00 | 0 |
| Meadow Close | 196,719.00 | 902,110.00 | 0 |
| Meadow Road | 205,888.00 | 944,149.00 | 0 |
| Meadway | 698,540.00 | 3,203,618.00 | 1 |
| Medina Avenue | 163,701.00 | 750,671.00 | 1 |
| Melbury Close | 176,245.00 | 808,208.00 | 0 |
| Merrilyn Close | 217,816.00 | 998,836.00 | 0 |
| Milbourne Lane | 237,227.00 | 1,087,856.00 | 4 |
| Milbrook | 369,111.00 | 1,692,745.00 | 0 |
| Mill Road | 65,251.00 | 299,153.00 | 1 |
| Montgomery Avenue | 184,396.00 | 845,572.00 | 0 |
| More Lane | 224,147.00 | 1,027,893.00 | 1 |
| Mountview Road | 459,089.00 | 2,060,435.00 | 0 |
| Neville Close | 354,776.00 | 1,627,005.00 | 0 |
| New Road | 389,106.00 | 1,784,458.00 | 1 |
| Nightingale Road | 231,744.00 | 1,062,747.00 | 0 |
| Norfolk Road | 113,473.00 | 520,303.00 | 0 |
| Oak Tree Place | 162,616.00 | 745,711.00 | 0 |
| Oaken Drive | 197,647.00 | 906,364.00 | 1 |
| Oaken Lane | 202,777.00 | 929,884.00 | 1 |
| Oakhill | 199,715.00 | 915,843.00 | 0 |
| Oaklands Avenue | 275,378.00 | 1,262,851.00 | 0 |
| Old Claygate Lane | 153,678.00 | 704,712.00 | 1 |
| Orchard Gate | 408,366.00 | 1,872,772.00 | 0 |
| Orchard Way | 483,045.00 | 2,215,279.00 | 0 |
| Orleans Close | 154,170.00 | 706,945.00 | 0 |
| Park Close | 393,125.00 | 1,802,884.00 | 1 |
| Park Road | 128,877.00 | 590,963.00 | 1 |
| Park Square | 101,903.00 | 467,246.00 | 0 |
| Parkwood Avenue | 261,896.00 | 1,202,021.00 | 1 |
| Pelhams Close | 253,612.00 | 1,163,038.00 | 0 |
| Pelhams Walk | 354,694.00 | 1,626,612.00 | 1 |
| Pemberton Place | 238,565.00 | 1,094,030.00 | 0 |
| Poplar Road | 83,545.00 | 383,080.00 | 1 |
| Portsmouth Road | 178,011.00 | 816,309.00 | 2 |
| Pound Farm Close | 306,251.00 | 1,404,451.00 | 0 |
| Princess Square | 353,639.00 | 1,621,782.00 | 0 |
| Queen Anne Drive | 261,434.00 | 1,200,226.00 | 0 |
| Queens Close | 126,759.00 | 581,230.00 | 0 |
| Raleigh Drive | 266,767.00 | 1,223,366.00 | 0 |
| Raymond Way | 167,725.00 | 769,129.00 | 0 |
| Red Lane | 264,389.00 | 1,212,448.00 | 3 |
| Redruth Gardens | 351,264.00 | 1,610,891.00 | 0 |
| Riverside Drive | 301,789.00 | 1,383,965.00 | 0 |
| Rosebriars | 882,338.00 | 4,046,564.00 | 0 |
| Rosehill | 182,135.00 | 835,228.00 | 0 |
| Ruxley Crescent | 345,484.00 | 1,584,374.00 | 2 |
| Ruxley Ridge | 250,142.00 | 1,147,104.00 | 0 |
| Ruxley Towers | 315,588.00 | 1,447,272.00 | 0 |
| Rythe Close | 166,854.00 | 765,133.00 | 1 |
| Rythe Road | 172,353.00 | 790,343.00 | 1 |
| Sandon Close | 257,877.00 | 1,182,578.00 | 1 |
| Sandown Avenue | 817,143.00 | 3,747,556.00 | 1 |
| Sandown Gate | 184,906.00 | 847,932.00 | 0 |
| Sandown Road | 592,517.00 | 2,717,362.00 | 0 |
| Severn Drive | 177,210.00 | 812,616.00 | 3 |
| Sherriff Close | 73,838.00 | 338,535.00 | 4 |
| Simmil Road | 150,904.00 | 691,974.00 | 2 |
| Simmons Gate | 424,165.00 | 1,945,249.00 | 0 |
| Southwood Gardens | 215,852.00 | 989,852.00 | 1 |
| Spinney Gardens | 295,295.00 | 1,354,181.00 | 0 |
| St Georges Place | 651,531.00 | 2,988,004.00 | 1 |
| St Leonards Road | 237,318.00 | 1,088,314.00 | 2 |
| Station Approach | 72,493.00 | 332,351.00 | 2 |
| Station Road (Claygate) | 123,894.00 | 568,085.00 | 4 |
| Station Road (Esher) | 193,662.00 | 888,078.00 | 1 |
| Station Way | 98,196.00 | 450,238.00 | 0 |
| Stevens Lane | 256,651.00 | 1,176,978.00 | 2 |
| Stockfield Road | 203,781.00 | 934,490.00 | 0 |
| Sydney Terrace | 156,973.00 | 719,817.00 | 0 |
| Telegraph Lane | 145,124.00 | 665,473.00 | 3 |
| Tellisford | 268,681.00 | 1,232,155.00 | 0 |
| The Avenue | 264,408.00 | 1,212,549.00 | 1 |
| The Causeway | 241,841.00 | 1,109,027.00 | 0 |
| The Drive | 266,032.00 | 1,219,984.00 | 2 |
| The Elms | 85,498.00 | 391,999.00 | 0 |
| The Furlongs | 140,454.00 | 644,052.00 | 0 |
| The Gallops | 170,892.00 | 783,651.00 | 2 |
| The Gardens | 567,414.00 | 2,602,216.00 | 1 |
| The Green | 110,806.00 | 508,072.00 | 0 |
| The Maples | 302,454.00 | 1,387,046.00 | 0 |
| The Mews, Albany Crescent | 231,186.00 | 1,060,182.00 | 0 |
| The Mount | 614,383.00 | 2,817,631.00 | 0 |
| The Parade | 77,415.00 | 354,933.00 | 0 |
| The Roundway | 106,506.00 | 488,336.00 | 0 |
| The Rythe, Copsem Lane | 269,396.00 | 1,235,416.00 | 0 |
| The Willows, Albany Crescent | 90,357.00 | 414,280.00 | 1 |
| The Woodlands | 204,027.00 | 915,610.00 | 1 |
| Thomas More Gardens | 306,842.00 | 1,407,169.00 | 0 |
| Thorne Close | 178,531.00 | 818,687.00 | 3 |
| Torrington Close | 258,884.00 | 1,187,196.00 | 0 |
| Torrington Road | 200,337.00 | 918,703.00 | 1 |
| Tower Gardens | 245,319.00 | 1,124,986.00 | 1 |
| Trystings Close | 230,470.00 | 1,056,893.00 | 0 |
| Vale Croft | 249,044.00 | 1,142,082.00 | 0 |
| Vale Road | 150,692.00 | 691,009.00 | 1 |
| Vincent Close | 363,711.00 | 1,667,988.00 | 0 |
| Warren Close | 257,132.00 | 1,179,171.00 | 0 |
| Wayneflete Tower Avenue | 365,688.00 | 1,677,035.00 | 0 |
| West Acres | 349,941.00 | 1,570,529.00 | 0 |
| West End Gardens | 221,566.00 | 1,016,055.00 | 1 |
| West End Lane | 173,944.00 | 797,635.00 | 2 |
| Westbury Avenue | 234,569.00 | 1,075,680.00 | 0 |
| Westmont Road | 172,226.00 | 789,769.00 | 0 |
| Weston Green Road | 231,186.00 | 1,060,182.00 | 0 |
| Westwood Close | 292,583.00 | 1,341,769.00 | 0 |
| Willowmere | 365,400.00 | 1,675,724.00 | 0 |
| Winchester Close | 323,273.00 | 1,482,520.00 | 1 |
| Winterdown Gardens | 164,300.00 | 753,413.00 | 0 |
| Winterdown Road | 188,104.00 | 862,573.00 | 2 |
| Wolsey Grove | 94,384.00 | 432,486.00 | 1 |
| Wolsey Road | 188,220.00 | 863,127.00 | 1 |
| Woodbourne Drive | 193,866.00 | 889,026.00 | 0 |
| Woodend | 166,976.00 | 749,318.00 | 0 |
| Woodlands Close | 208,931.00 | 958,115.00 | 0 |
| Woodside Avenue | 238,266.00 | 1,092,643.00 | 1 |
| Woodstock Lane South | 231,186.00 | 1,060,182.00 | 0 |
| Woodward Close | 231,186.00 | 1,060,182.00 | 0 |
| Wootton Place | 738,251.00 | 3,385,740.00 | 0 |
TOP 25 ROADS BY VALUE INCREASE
Road Name |
Price Change 5 years (+) |
Current Average Value £ |
Number of transactinos last 12 months |
| Claremont Park Road | 986,560.00 | 4,524,574.00 | 0 |
| Blackhills | 911,204.00 | 4,178,955.00 | 1 |
| Rosebriars | 882,338.00 | 4,046,564.00 | 0 |
| Clare Hill | 831,726.00 | 3,814,436.00 | 1 |
| Sandown Avenue | 817,143.00 | 3,747,556.00 | 1 |
| Heckets Court | 816,556.00 | 3,744,861.00 | 0 |
| Wootton Place | 738,251.00 | 3,385,740.00 | 0 |
| Meadway | 698,540.00 | 3,203,618.00 | 1 |
| Littleworth Lane | 686,777.00 | 3,149,653.00 | 0 |
| St Georges Place | 651,531.00 | 2,988,004.00 | 1 |
| Cranford Rise | 646,792.00 | 2,966,266.00 | 0 |
| Littleworth Common Road | 640,818.00 | 2,938,869.00 | 0 |
| Claremont Drive | 637,611.00 | 2,924,477.00 | 1 |
| The Mount | 614,383.00 | 2,817,631.00 | 0 |
| Sandown Road | 592,517.00 | 2,717,362.00 | 0 |
| Acorns Way | 590,488.00 | 2,708,049.00 | 0 |
| The Gardens | 567,414.00 | 2,602,216.00 | 1 |
| Ashburnham Park | 532,347.00 | 2,389,218.00 | 0 |
| Arbrook Chase | 524,196.00 | 2,404,007.00 | 0 |
| Albany Close | 522,427.00 | 2,395,900.00 | 1 |
| Claremont End | 520,354.00 | 2,386,372.00 | 0 |
| Broom Close | 516,905.00 | 2,373,208.00 | 1 |
| Copsem Way | 509,949.00 | 2,338,662.00 | 0 |
| Littleworth Avenue | 494,008.00 | 2,265,560.00 | 1 |
| Littlemead | 484,012.00 | 2,219,714.00 | 0 |
TOP 25 LIST BY NUMBER OF COMPLETED TRANSACTIONS
Road Name |
Price Change 5 years (+) |
Current Average Value £ |
Number of transactions last 12 months |
| Manor Road South | 233,455.00 | 1,070,587.00 | 16 |
| Manor Road North | 230,708.00 | 1,057,992.00 | 12 |
| Coverts Road | 118,415.00 | 542,969.00 | 7 |
| Grove Way | 257,922.00 | 1,182,790.00 | 5 |
| Ember Lane | 260,299.00 | 1,193,691.00 | 4 |
| Milbourne Lane | 237,227.00 | 1,087,856.00 | 4 |
| Greenways | 193,185.00 | 885,896.00 | 4 |
| Avondale Avenue | 189,220.00 | 867,697.00 | 4 |
| Station Road (Claygate) | 123,894.00 | 568,085.00 | 4 |
| Foxwarren | 91,506.00 | 419,564.00 | 4 |
| Sherriff Close | 73,838.00 | 338,535.00 | 4 |
| Esher Park Avenue | 441,384.00 | 2,024,205.00 | 3 |
| Red Lane | 264,389.00 | 1,212,448.00 | 3 |
| Chestnut Avenue | 226,319.00 | 1,037,857.00 | 3 |
| Copsem Lane | 202,892.00 | 930,407.00 | 3 |
| Hare Lane | 197,435.00 | 905,397.00 | 3 |
| Imber Grove | 188,673.00 | 865,199.00 | 3 |
| Thorne Close | 178,531.00 | 818,687.00 | 3 |
| Severn Drive | 177,210.00 | 812,616.00 | 3 |
| Lower Green Road | 157,918.00 | 724,149.00 | 3 |
| Telegraph Lane | 145,124.00 | 665,473.00 | 3 |
| Common Road | 139,868.00 | 641,370.00 | 3 |
| Douglas Road | 91,933.00 | 421,518.00 | 3 |
| Farm Road | 67,841.00 | 311,026.00 | 3 |
| Hawkshill Close | 381,887.00 | 1,751,327.00 |
2 |
Most will already know that the KT10 postcode is home to some of the highest property values outside of London, mainly driven by demand from buyers moving out of London to Surrey for more outdoor space, excellent schools and a greater sense of community. Esher, Claygate and Hinchley Wood tick all of those boxes, so it is no surprise that those that move to the area, tend to stay here, and those moving out of London gravitate towards these locations.
GET AN ESTIMATED VALUE OF YOUR OWN PROPERTY IN 60 SECONDS.
BOOK A FREE FACE-TO-FACE VALUATION WITH ONE OF OUR AGENTS.
Elevating the Elmbridge property market
Visit us in Molesey
East Molesey
Surrey
KT8 9ER
VISIT US IN ESHER
Claygate
Esher
Surrey
KT10 0PD